Stock Analysis · INNIO N.V (INIO)
Overview
INNIO N.V. is an industrial energy equipment company focused on decentralized power generation. Through its well-known Jenbacher and Waukesha brands, it makes gas engines and related systems used to generate electricity, heat, and mechanical power. These products are typically used by utilities, industrial sites, commercial facilities, and energy infrastructure operators that need reliable on-site or local power rather than depending only on the main grid.
The company is increasingly positioned around the energy transition. Its engines can run on natural gas and, in some applications, other lower-carbon fuels such as biogas, landfill gas, sewage gas, and blends with hydrogen. INNIO also provides digital monitoring, maintenance, upgrades, and lifecycle services, which are important because customers often operate these engines for many years.
Based on company reporting, revenue is mainly split between equipment sales and recurring service activity. The broad revenue mix appears to be organized as follows:
- Services and aftermarket support: approximately 50% to 60% of revenue. This includes maintenance contracts, spare parts, upgrades, repairs, remote monitoring, and long-term lifecycle support for installed engines.
- Equipment and package sales: approximately 40% to 50% of revenue. This includes new Jenbacher and Waukesha engines, packaged power solutions, and related systems sold into power generation, oil and gas, and industrial applications.
That mix matters for long-term analysis because service revenue is usually steadier than new equipment sales. It also creates a large installed-base effect: once an engine is deployed, the customer often remains tied to parts, technical support, and performance optimization for years.
Financially, the business has been expanding with revenue moving from about $2.0 billion in 2023 to about $2.6 billion in 2025. Profitability improved as well at the operating level, although financing costs still absorb a meaningful share of earnings. Gross profit has grown faster than revenue over that period, suggesting a favorable mix and pricing backdrop, but interest expense remains a notable drag on net income.
The revenue-to-profit flow shows a business that has recently scaled well: sales, gross profit, and operating income all moved higher over the last three years. The most visible constraint is below operating income, where interest expense remains large enough to materially reduce the earnings that reach shareholders.
Key Figures
| Metric | Value | Sector ⓘ |
|---|---|---|
| Date | Oct 24, 2026 | |
| Context | ||
| Sector | Industrials | |
| Industry | Specialty Industrial Machinery | |
| Market Cap ⓘ | $12.17B | |
| Beta ⓘ | N/A | |
Value (Cheapness) | ||
| P/E Ratio ⓘ | N/A | 22.29 |
| P/B Ratio ⓘ | 63.48 | 1.98 |
| FCF Yield ⓘ | 3.18% | 6.26% |
| Dividend Yield ⓘ | N/A | 1.92% |
| EBIT / EV ⓘ | 1.74% | 4.83% |
| PEG ⓘ | N/A | |
Growth (Business expansion) | ||
| Revenue Growth ⓘ | 42.20% | 9.30% |
| RPS Growth (5Y CAGR) ⓘ | 14.38% | 7.76% |
| EPS Growth (5Y CAGR) ⓘ | N/A | -13.17% |
| BVPS Growth (5Y CAGR) ⓘ | -51.32% | 6.13% |
| Margin Growth (5Y Trend) ⓘ | 1.15% | 0.74% |
| FCF Growth (5Y CAGR) ⓘ | 130.05% | 10.79% |
| DPS Growth (5Y CAGR) ⓘ | N/A | 9.41% |
Quality (Business durability) | ||
| ROIC (Latest) ⓘ | N/A | 10.75% |
| ROA (Latest) ⓘ | N/A | 5.41% |
| ROIC (5Y Median) ⓘ | N/A | 9.37% |
| ROA (5Y Median) ⓘ | N/A | 4.95% |
| Net Debt / EBIT (Latest) ⓘ | 5.73 | 2.04 |
| Net Debt / EBIT (5Y Median) ⓘ | 5.86 | 2.27 |
| Net Debt / EBITDA (Latest) ⓘ | 3.61 | 1.39 |
| Net Debt / Assets ⓘ | 29.00% | 19.27% |
| EBITDA / Interest ⓘ | 2.65 | 9.58 |
| Operating Margin (Latest) ⓘ | 10.50% | 10.49% |
| Operating Margin (5Y Median) ⓘ | 13.19% | 10.30% |
| Debt to Equity (Latest) ⓘ | 1290.63% | 64.82% |
| Profit Margin (Latest) ⓘ | 0.79% | 6.67% |
| Free Cash Flow (Latest) ⓘ | $386.77M | |
Momentum (Price trend) | ||
| 3Y Return ⓘ | N/A | +67.77% |
| 12M Return (excl. last month) ⓘ | N/A | +12.05% |
| 6M Return ⓘ | N/A | 0.00% |
| Price vs. 200-Day MA ⓘ | N/A | +0.67% |
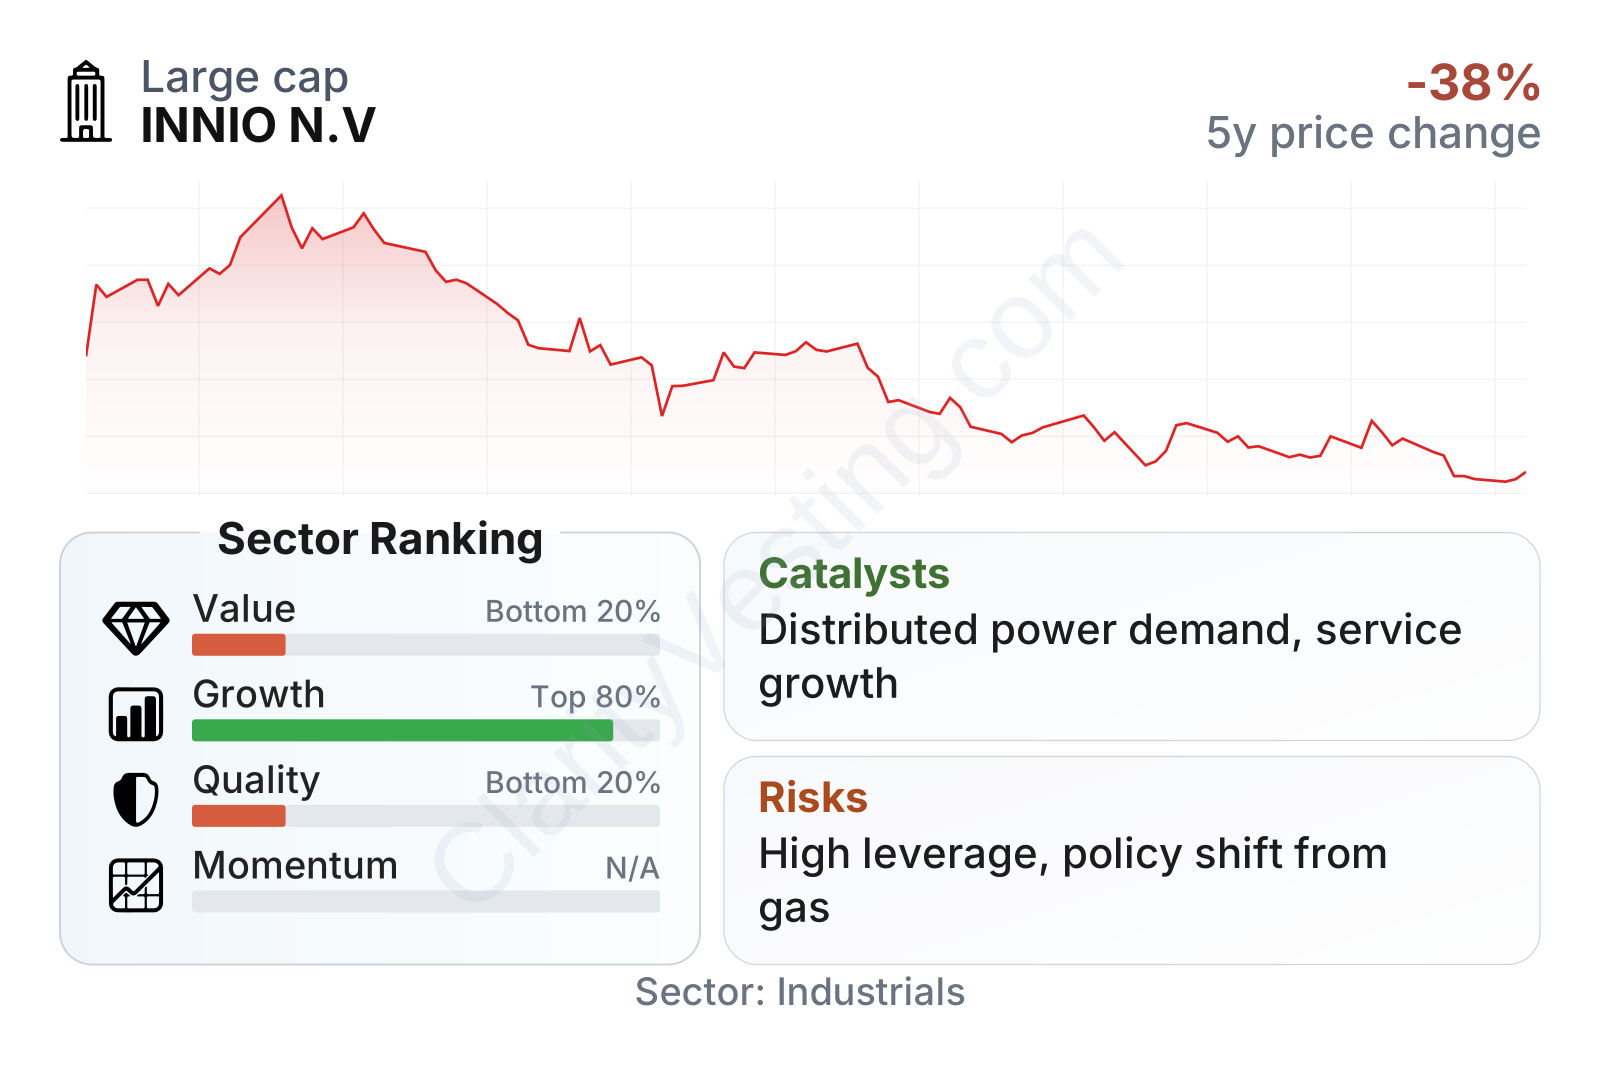
The stock has been volatile in recent months, with a noticeable pullback from its mid-2026 level. In the metrics table, the strongest area is growth: revenue growth, revenue per share expansion, and free cash flow growth stand well above typical sector levels. Operating margins are also respectable for an industrial machinery company.
The weaker side is balance-sheet quality and valuation. Leverage is high relative to the sector, interest coverage is thin, and profit margin is still modest after financing costs. On valuation measures, the company screens as expensive on several conventional ratios, especially book value and enterprise-value-based earnings measures, which means the market is already recognizing a meaningful part of its operating progress.
Growth
INNIO operates in a part of the energy and industrial economy that has real long-term relevance. Power systems that can be installed close to where electricity is consumed are gaining attention because grids in many regions are under pressure from electrification, rising peak demand, renewable intermittency, and the need for resilience. That creates room for flexible generation assets that can start quickly, support local reliability, and in some cases use renewable gases or hydrogen blends.
The company’s strategy is logical in that context. It is not trying to compete as a pure-play wind, solar, or battery manufacturer. Instead, it occupies a practical middle ground: dispatchable distributed energy, combined heat and power, and backup or balancing capacity. For many customers, especially industrial users and critical infrastructure operators, this remains an economically relevant category even as renewable penetration rises.
Another important growth angle is the installed base. Once INNIO places an engine, it can generate recurring service revenue over a long period. That can make growth more durable than a simple equipment-cycle business. It also raises switching costs because customers often prefer to stay with the original manufacturer for maintenance, spare parts, software, and performance upgrades.
Recent financial progress supports the idea that this strategy is working. Revenue growth has been far above the sector median, operating income has increased over the last three years, and free cash flow generation has become more meaningful. The business also appears well aligned with demand for data-center power, local energy resilience, biogas-based generation, and modernization of aging thermal assets in markets where full grid reinforcement will take years.
A notable catalyst is the broader need for firm and flexible power as electricity demand rises. If power markets continue to reward reliability, fast deployment, and fuel flexibility, INNIO’s product set could remain relevant even in a lower-carbon system. Digital services and upgrades can also expand wallet share without requiring the same amount of capital as winning entirely new engine installations.
Risks
This article is for informational purposes only and does not constitute financial advice. Some content is AI-generated. See Disclaimer