Stock Analysis · Independent Bank (INDB)
Overview
Independent Bank Corp. is the parent company of Rockland Trust, a Massachusetts-based regional bank serving individuals, small businesses, commercial clients, and wealth customers across the Northeast. Its business is straightforward: it gathers deposits from customers, lends that money out at higher rates, provides fee-based banking and wealth services, and earns the spread and related service income. Like most regional banks, results depend heavily on loan growth, deposit costs, credit quality, and how well management balances growth with risk.
The company’s revenue mix is led by net interest income, which is the difference between what it earns on loans and securities and what it pays on deposits and borrowings. Non-interest income adds a smaller but still useful layer of diversification through service fees, wealth management, card-related fees, mortgage banking, and deposit account charges. Based on the company’s recent annual profile, the revenue mix is approximately:
- Net interest income: about 80% to 85% of total revenue. This is mainly generated from commercial loans, commercial real estate, residential lending, home equity, and investment securities, net of interest paid on deposits and other funding.
- Wealth management and trust fees: about 5% to 7%. This includes investment management, fiduciary, and related advisory services.
- Deposit service charges and fees: about 3% to 5%. This incorporates account-related fees, treasury management, and transaction services.
- Bank card, interchange, and other service income: about 2% to 4%. These are fees tied to debit and payment activity and other routine banking services.
- Mortgage banking, swap fees, and other non-interest income: about 3% to 6%. This category can move around more from year to year depending on rate conditions and customer activity.
That mix makes Independent Bank primarily a traditional spread-based bank rather than a fee-heavy financial company. The upside is that banking can be very profitable when deposits are stable and loan yields are attractive. The drawback is that earnings can become more sensitive to interest rates and funding pressure than at more diversified peers.
The financial flow over the last several years points to a business that has expanded revenue materially, especially after acquisitions and balance-sheet growth, but also one where interest expense and operating costs climbed sharply. Revenue has moved meaningfully higher since 2021, yet net income has not kept pace in the same proportion, showing that growth has come with margin pressure.
Key Figures
| Metric | Value | Sector ⓘ |
|---|---|---|
| Date | Oct 19, 2026 | |
| Context | ||
| Sector | Financial Services | |
| Industry | Banks - Regional | |
| Market Cap ⓘ | $3.78B | |
| Beta ⓘ | 0.80 | |
Value (Cheapness) | ||
| P/E Ratio ⓘ | 11.76 | 12.26 |
| P/B Ratio ⓘ | 1.09 | 1.23 |
| FCF Yield ⓘ | 8.26% | 10.40% |
| Dividend Yield ⓘ | 3.26% | 3.02% |
| EBIT / EV ⓘ | 8.54% | 8.14% |
| PEG ⓘ | 11.00 | |
Growth (Business expansion) | ||
| Revenue Growth ⓘ | 24.50% | 9.25% |
| RPS Growth (5Y CAGR) ⓘ | 12.38% | 12.19% |
| EPS Growth (5Y CAGR) ⓘ | -2.52% | -9.36% |
| BVPS Growth (5Y CAGR) ⓘ | -4.46% | 4.99% |
| Margin Growth (5Y Trend) ⓘ | -7.50% | -3.86% |
| FCF Growth (5Y CAGR) ⓘ | 9.76% | 4.81% |
| DPS Growth (5Y CAGR) ⓘ | 3.96% | 8.79% |
Quality (Business durability) | ||
| ROIC (Latest) ⓘ | 5.12% | 9.49% |
| ROE (Latest) ⓘ | 9.31% | 13.87% |
| ROA (Latest) ⓘ | 1.31% | 1.54% |
| ROIC (5Y Median) ⓘ | 5.17% | 7.86% |
| ROE (5Y Median) ⓘ | 6.52% | 12.17% |
| ROA (5Y Median) ⓘ | 0.99% | 1.30% |
| Net Debt / EBIT (Latest) ⓘ | 1.58 | 0.99 |
| Net Debt / EBIT (5Y Median) ⓘ | 1.95 | 0.73 |
| Net Debt / EBITDA (Latest) ⓘ | -0.08 | 0.91 |
| Operating Margin (Latest) ⓘ | 22.66% | 22.30% |
| Operating Margin (5Y Median) ⓘ | 30.36% | 24.63% |
| Debt to Equity (Latest) ⓘ | 18.17% | 58.04% |
| Profit Margin (Latest) ⓘ | 32.72% | 26.57% |
| Free Cash Flow (Latest) ⓘ | $312.53M | |
Momentum (Price trend) | ||
| 3Y Return ⓘ | +78.81% | +88.26% |
| 12M Return (excl. last month) ⓘ | +21.92% | +19.24% |
| 6M Return ⓘ | +3.46% | +4.70% |
| Price vs. 200-Day MA ⓘ | +0.99% | +3.66% |
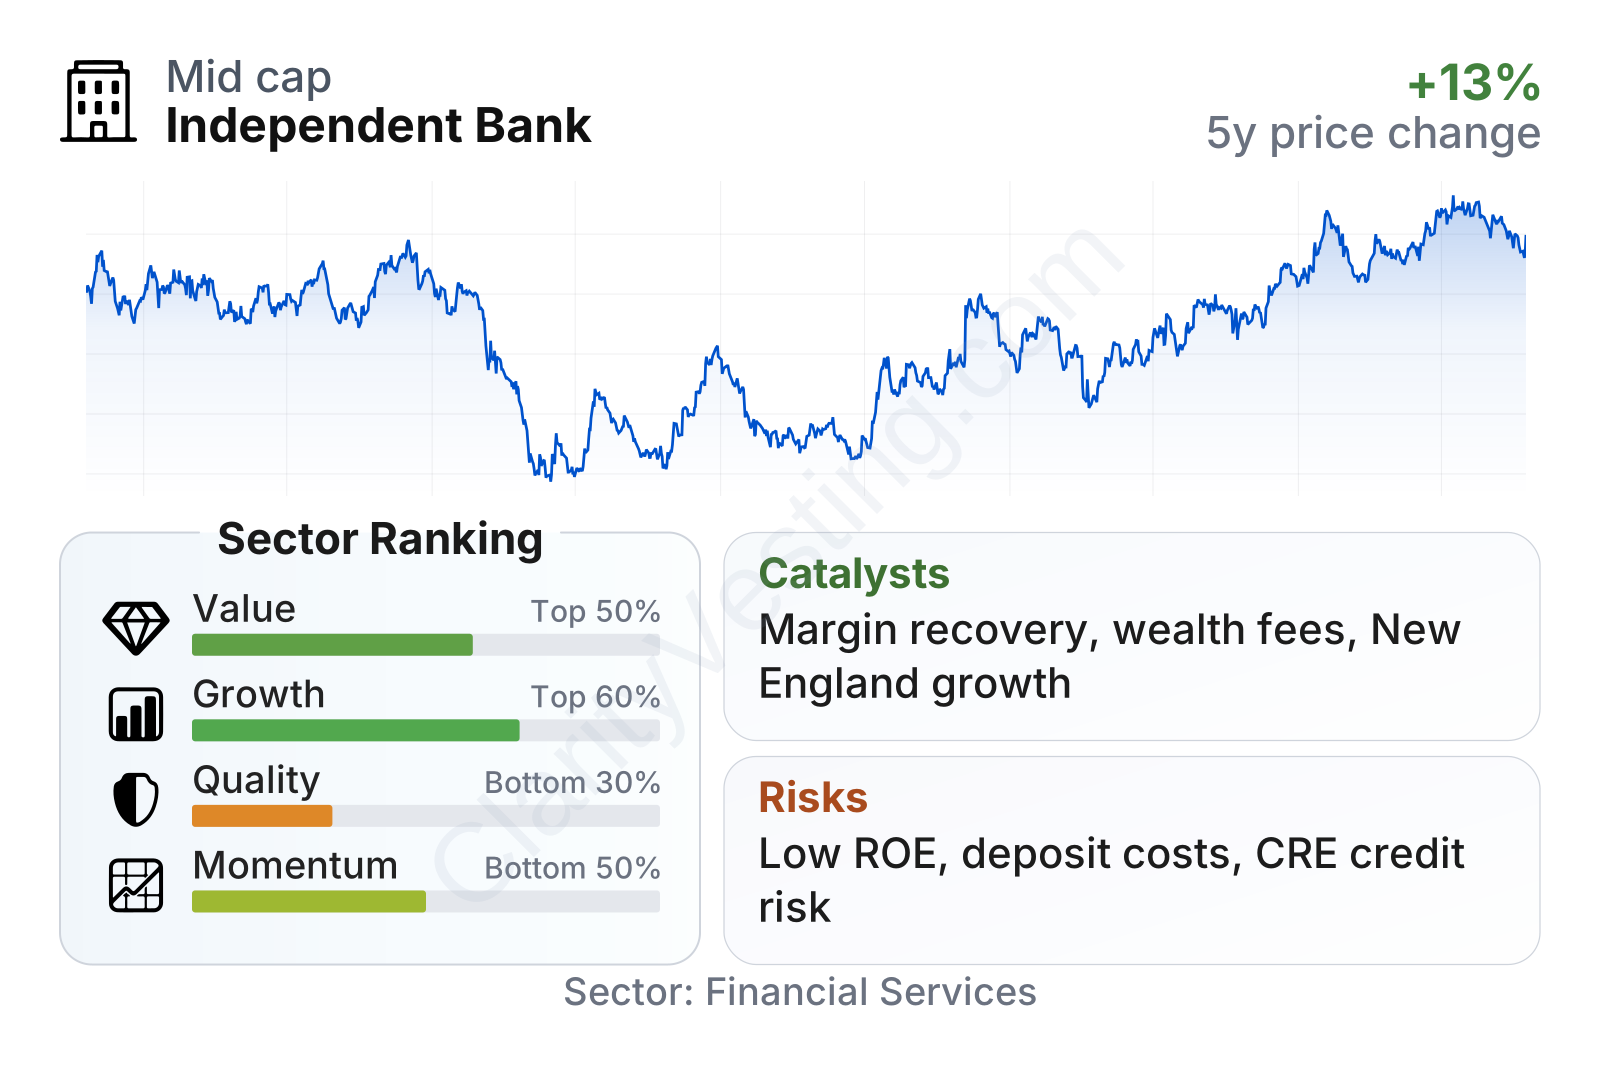
Independent Bank sits in the middle of the pack on valuation and growth, but clearly weaker on quality metrics relative to many regional bank peers. The stock’s valuation multiples are close to or slightly below sector medians, while dividend yield is modestly above typical regional bank levels. Revenue growth has been strong recently, but returns on equity and assets remain below sector norms. Market performance has improved from the 2023 regional banking stress period, though the longer-term share-price path still reflects a bank rebuilding confidence rather than one consistently outperforming its group.
The share price history also shows that the market treated Independent Bank like many regional banks during the 2023 banking turmoil, with a sharp drawdown followed by a recovery. Since then, the rebound has been solid, and the stock has recently climbed above pre-crisis levels. That recovery suggests investors are assigning more stability to deposits, capital, and earnings than they did during the sector panic, but it does not erase the underlying profitability questions.
Growth
Independent Bank operates in a sector that is mature rather than fast-growing, but regional banking still offers room for steady expansion through market share gains, acquisitions, commercial lending, and wealth management. In this case, the company’s footprint in Massachusetts and the broader New England area gives it exposure to relatively affluent markets with dense small-business activity and attractive household deposit bases. That is usually a better backdrop than lower-income or more volatile regions, especially for a bank focused on relationship banking.
The strategy broadly makes sense for long-term development. Independent Bank has been using acquisitions, commercial banking expansion, and cross-selling of wealth and treasury services to deepen customer relationships. For a regional bank, that matters because stronger operating leverage usually comes from serving the same customer with more products rather than relying only on new branches. The recent revenue growth rate, well above the sector median, shows that the company has been able to expand its top line faster than many peers, even if that has not fully translated into superior returns yet.
Earnings per share have not followed a perfectly smooth upward line. Results were strong in 2022, softened in 2023 and 2024, then improved again in 2025 and into 2026. That pattern fits a bank working through higher funding costs after the sharp rise in interest rates. In simple terms, Independent Bank has been growing, but not with the kind of clean earnings momentum that would signal a clear breakout in profitability.
Book value per share, an important measure for banks because it reflects the net value of assets after liabilities, fell sharply after 2021 and then recovered gradually over the following years. The recovery is encouraging because it suggests balance-sheet value is stabilizing and rebuilding, but the five-year picture still looks weaker than the sector median. For long-term analysis, this matters because healthy banks often combine book value growth with steady earnings expansion over time.
A practical catalyst for future growth is the possibility of improved net interest margin if deposit pricing stabilizes and asset yields remain healthy. Another is continued integration and optimization from past acquisitions, which can lift efficiency over time. Expansion in wealth management and commercial treasury services is also meaningful because fee income is less balance-sheet intensive than plain lending. Recent company updates have also pointed to continued loan and deposit positioning in core markets, which supports a gradual growth case even without dramatic industry tailwinds.
Risks
This article is for informational purposes only and does not constitute financial advice. Some content is AI-generated. See Disclaimer


