Stock Analysis · Webuild SpA (IMPJY)
Overview
Webuild SpA is a large Italian engineering and construction group focused on complex infrastructure. The company designs and builds projects such as railways, metros, roads, highways, bridges, tunnels, ports, dams, hydropower plants, water-treatment systems, and some large civil buildings. Its activities are spread across Italy, the rest of Europe, Australia, North America, and selected markets in the Middle East and other international regions.
For a long-term view, the business is best understood as a contractor exposed to public infrastructure spending. Revenue does not come from small recurring subscriptions or consumer sales; it comes from executing large multiyear projects, often backed by governments or public agencies. That makes results heavily influenced by the pace of project awards, construction progress, claims resolution, and cash collection.
The company’s revenue mix is mainly organized by project type rather than simple product lines. Based on recent annual reporting and backlog disclosures, the main sources of revenue are broadly concentrated in the following areas:
- Transportation infrastructure: approximately 55% to 65% of activity. This includes high-speed rail, conventional rail, metros, roads, highways, bridges, and tunnels.
- Water and hydropower infrastructure: approximately 20% to 30%. This includes dams, hydropower plants, desalination, water conveyance, and related systems.
- Buildings and other civil engineering works: approximately 10% to 20%. This includes hospitals, airports, urban works, and other large public or concession-related structures.
Geographically, Italy remains strategically important because of rail and mobility projects supported by national and European funding, but Webuild also has meaningful exposure to Australia and other foreign markets. That international spread helps diversify demand, although it also adds execution and political complexity.
The business has expanded sharply in recent years. Revenue moved from roughly €6.0 billion in 2021 to more than €12.1 billion in 2025, while net income turned positive after a loss in 2021. The broad direction is favorable, but the path has not been smooth: operating profit has been volatile, showing how contract timing and cost control can materially affect reported performance in this industry.
The income flow over the last few years shows a business that has scaled up quickly, with a much larger revenue base than in 2021 and a clear recovery in net income from earlier losses. At the same time, operating profitability has been uneven, which is typical for large construction groups but still important because small margin swings can have a large impact on earnings and cash generation.
Key Figures
| Metric | Value | Sector ⓘ |
|---|---|---|
| Date | Oct 17, 2026 | |
| Context | ||
| Sector | Industrials | |
| Industry | Engineering & Construction | |
| Market Cap ⓘ | $2.04B | |
| Beta ⓘ | 1.08 | |
Value (Cheapness) | ||
| P/E Ratio ⓘ | 7.00 | 22.10 |
| P/B Ratio ⓘ | 1.31 | 1.97 |
| FCF Yield ⓘ | -54.91% | 6.38% |
| Dividend Yield ⓘ | 4.54% | 1.94% |
| EBIT / EV ⓘ | N/A | 4.79% |
| PEG ⓘ | N/A | |
Growth (Business expansion) | ||
| Revenue Growth ⓘ | -3.40% | 9.30% |
| RPS Growth (5Y CAGR) ⓘ | 17.79% | 7.81% |
| EPS Growth (5Y CAGR) ⓘ | N/A | -13.06% |
| BVPS Growth (5Y CAGR) ⓘ | -1.88% | 6.14% |
| Margin Growth (5Y Trend) ⓘ | -0.68% | 0.88% |
| FCF Growth (5Y CAGR) ⓘ | N/A | 11.01% |
| DPS Growth (5Y CAGR) ⓘ | 8.41% | 9.48% |
Quality (Business durability) | ||
| ROIC (Latest) ⓘ | N/A | 10.84% |
| ROA (Latest) ⓘ | 2.24% | 5.41% |
| ROIC (5Y Median) ⓘ | 0.47% | 9.38% |
| ROA (5Y Median) ⓘ | 0.85% | 4.95% |
| Net Debt / EBIT (Latest) ⓘ | N/A | 2.08 |
| Net Debt / EBIT (5Y Median) ⓘ | 2.43 | 2.27 |
| Net Debt / EBITDA (Latest) ⓘ | 1.53 | 1.39 |
| Net Debt / Assets ⓘ | 5.22% | 19.28% |
| EBITDA / Interest ⓘ | N/A | 9.58 |
| Operating Margin (Latest) ⓘ | -0.71% | 10.50% |
| Operating Margin (5Y Median) ⓘ | 0.47% | 10.29% |
| Debt to Equity (Latest) ⓘ | 189.49% | 65.48% |
| Profit Margin (Latest) ⓘ | 1.95% | 6.67% |
| Free Cash Flow (Latest) ⓘ | -$1.12B | |
Momentum (Price trend) | ||
| 3Y Return ⓘ | +29.06% | +61.68% |
| 12M Return (excl. last month) ⓘ | -43.67% | +12.58% |
| 6M Return ⓘ | -27.72% | 0.00% |
| Price vs. 200-Day MA ⓘ | -31.32% | +0.02% |
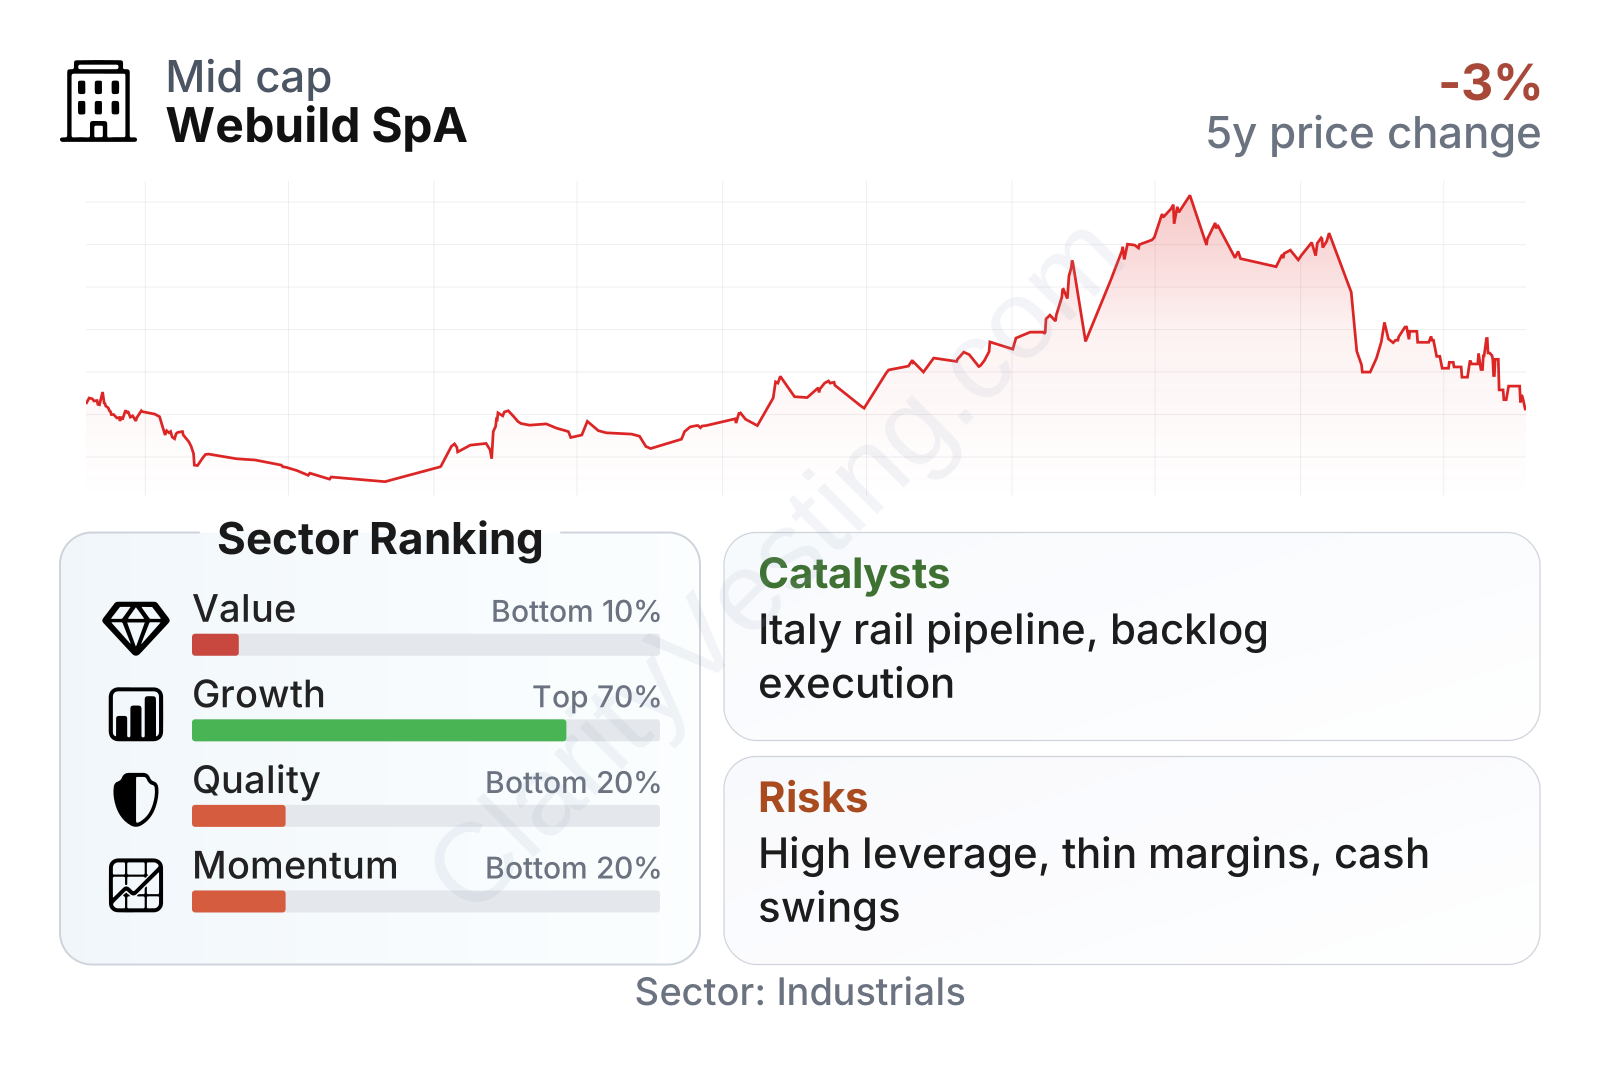
Webuild is a mid-sized public company within a very large industrial peer group. The valuation multiples look low compared with the sector, especially on earnings and book value, and the dividend yield is above the sector median. However, those cheaper multiples come with weaker quality indicators, including thin profitability and higher leverage. Growth is mixed: the longer-term revenue trend has been solid, but the most recent year-over-year revenue reading softened and market momentum has weakened noticeably.
The share price history reflects that mixed picture. The stock rose strongly into 2025 before giving back part of that advance in 2026. That decline happened even as the earnings multiple compressed to a much lower level than the sector, suggesting the market has become more cautious about margin durability, cash conversion, or balance-sheet risk rather than simply ignoring the company.
Growth
Webuild operates in a sector with genuine structural support. Many developed economies are increasing spending on transportation networks, energy transition infrastructure, water systems, and climate-resilience projects. Rail modernization, urban transit, dam safety, and hydropower upgrades all fit the company’s capabilities. In Europe, public investment programs and mobility decarbonization remain important tailwinds. In Australia, transport and civil infrastructure pipelines also continue to support demand for major contractors.
The company’s strategy is logical for this backdrop. Webuild has positioned itself around technically demanding projects where scale, engineering capability, and prequalification matter. That can be a better niche than competing for simpler jobs with lower barriers to entry. It also benefits from a large order backlog, which provides visibility beyond a single year and can help smooth revenue over time.
A meaningful catalyst is the continued execution of major rail and mobility programs in Italy, including projects connected to national infrastructure renewal and broader European funding priorities. Another catalyst is the company’s international presence in markets where governments are still commissioning large transport and water projects. If Webuild continues converting backlog into revenue while maintaining discipline on bids, that combination could support further business expansion.
Recent corporate updates have also pointed to backlog strength and a focus on operational delivery, debt discipline, and selective bidding. For a company like Webuild, that matters more than headline revenue alone. In construction, not all growth is equally valuable; the most important question is whether new contracts can be executed at acceptable margins and converted into cash.
Cash generation deserves close attention. Free cash flow was positive at the end of 2024 and then turned negative on a trailing basis by mid-2025. That does not automatically signal deterioration because working capital can swing sharply as projects advance, but it does underline a core feature of the business: accounting profit and cash flow can diverge significantly over shorter periods.
Risks
This article is for informational purposes only and does not constitute financial advice. Some content is AI-generated. See Disclaimer


