Stock Analysis · Illumina Inc (ILMN)
Overview
Illumina is a life sciences company best known for DNA sequencing systems. In simple terms, it sells the machines, consumables, and software that help laboratories read genetic material. Its platforms are used in research, clinical testing, oncology, reproductive health, and large population genomics programs. Illumina does not mainly operate as a drug developer; it is more of a tools-and-platform provider for genomics.
The business model is important for long-term analysis because Illumina creates an installed base of sequencing instruments and then generates recurring revenue from the consumables needed to run those systems. That makes the company partly similar to a “razor-and-blades” model: labs buy the equipment, then keep purchasing reagents, flow cells, and related supplies over time.
Based on the company’s recent annual reporting structure, revenue is mainly split between product sales and services, with product revenue by far the largest contributor. Within product revenue, consumables are typically the biggest component, followed by instruments, then software and other items.
- Consumables: approximately 60% to 70% of total revenue. This includes sequencing reagents, flow cells, library prep kits, and other supplies used repeatedly on installed systems.
- Instruments: approximately 20% to 30% of total revenue. This includes sequencing machines and related hardware sold to labs, hospitals, and research institutions.
- Services and other: approximately 10% to 15% of total revenue. This includes maintenance, support, training, and other customer services.
Geographically, Illumina has historically been broad-based, with the United States as its largest single market but with substantial business across Europe and Asia-Pacific. That diversification helps reduce dependence on one healthcare system or one research funding source, although it also exposes the company to regional regulation and procurement cycles.
Another notable point is that the company’s revenue has stayed in a fairly stable range in recent years, while profitability has moved much more sharply. The business went through a period of major disruption tied to acquisition-related issues and restructuring, but its core sequencing franchise remained intact. More recently, operating performance has improved materially, suggesting the main question is less about whether the company has a real business and more about how strong the next phase of recovery can become.
The longer-term pattern shows a business with resilient gross profit generation, a heavy commitment to research and development, and a sharp improvement in operating income in 2025 after losses in 2022 through 2024. That supports the view that the core franchise stayed productive even while reported earnings were distorted by exceptional items and strategic disruption.
Key Figures
| Metric | Value | Sector ⓘ |
|---|---|---|
| Date | Oct 24, 2026 | |
| Context | ||
| Sector | Healthcare | |
| Industry | Diagnostics & Research | |
| Market Cap ⓘ | $42.71B | |
| Beta ⓘ | 1.42 | |
Value (Cheapness) | ||
| P/E Ratio ⓘ | 52.77 | 25.42 |
| P/B Ratio ⓘ | 14.52 | 3.08 |
| FCF Yield ⓘ | 2.20% | 3.12% |
| Dividend Yield ⓘ | N/A | 1.85% |
| EBIT / EV ⓘ | 2.47% | 0.56% |
| PEG ⓘ | 3.05 | |
Growth (Business expansion) | ||
| Revenue Growth ⓘ | 9.40% | 7.50% |
| RPS Growth (5Y CAGR) ⓘ | -1.86% | 8.60% |
| EPS Growth (5Y CAGR) ⓘ | 4.05% | -17.73% |
| BVPS Growth (5Y CAGR) ⓘ | -29.62% | 3.72% |
| Margin Growth (5Y Trend) ⓘ | N/A | -0.57% |
| FCF Growth (5Y CAGR) ⓘ | 28.92% | 0.96% |
| DPS Growth (5Y CAGR) ⓘ | 106.04% | 6.69% |
Quality (Business durability) | ||
| ROIC (Latest) ⓘ | N/A | 3.17% |
| ROA (Latest) ⓘ | 12.86% | 2.98% |
| ROIC (5Y Median) ⓘ | -10.07% | 4.56% |
| ROA (5Y Median) ⓘ | -10.38% | 1.87% |
| Net Debt / EBIT (Latest) ⓘ | 1.36 | 1.34 |
| Net Debt / EBIT (5Y Median) ⓘ | N/A | 1.86 |
| Net Debt / EBITDA (Latest) ⓘ | 1.09 | 1.00 |
| Net Debt / Assets ⓘ | 22.36% | 5.06% |
| EBITDA / Interest ⓘ | N/A | 9.55 |
| Operating Margin (Latest) ⓘ | 24.26% | 9.25% |
| Operating Margin (5Y Median) ⓘ | -23.73% | 7.33% |
| Debt to Equity (Latest) ⓘ | 89.04% | 26.68% |
| Profit Margin (Latest) ⓘ | 18.34% | 3.34% |
| Free Cash Flow (Latest) ⓘ | $939.00M | |
Momentum (Price trend) | ||
| 3Y Return ⓘ | +131.81% | +51.61% |
| 12M Return (excl. last month) ⓘ | +143.83% | +19.90% |
| 6M Return ⓘ | +106.44% | +10.10% |
| Price vs. 200-Day MA ⓘ | +56.36% | +6.44% |
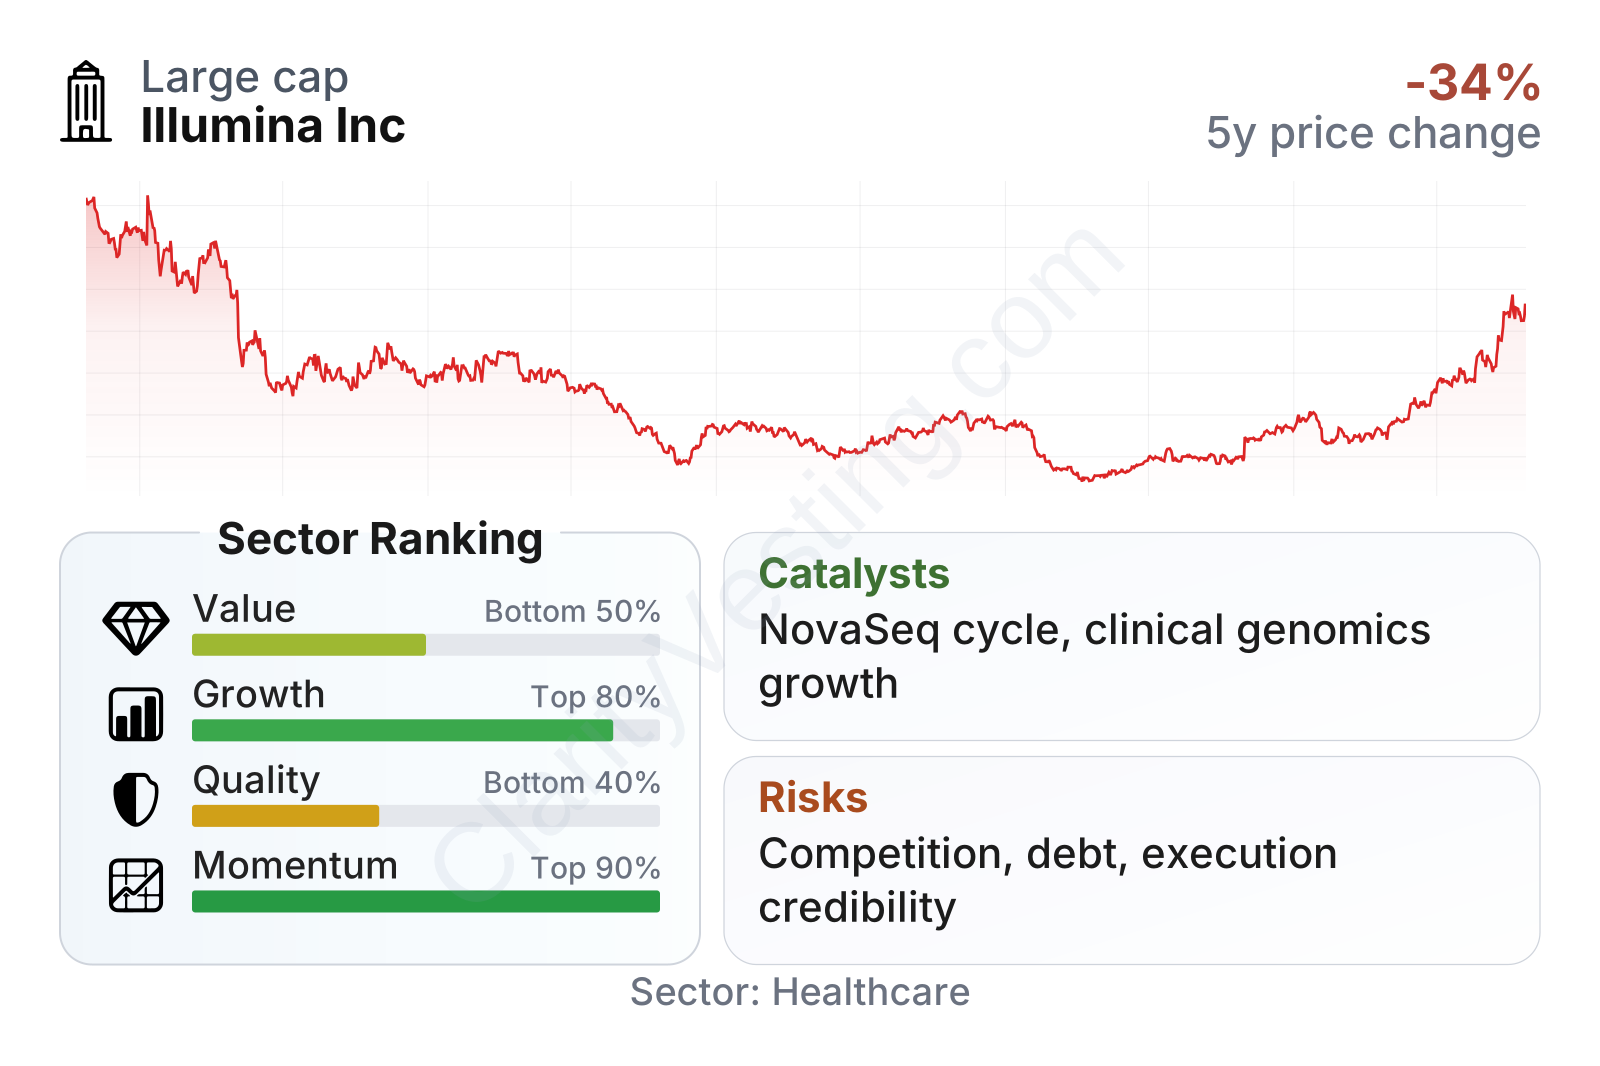
Illumina is a large company in diagnostics and research, but its share price history has been unusually volatile for a healthcare tools business. After a steep decline from 2021 into 2025, the stock rebounded strongly into 2026, which helps explain why momentum indicators now rank very high versus the sector. The table also points to a mixed profile: growth and recent market momentum look strong, profitability has recovered, but quality measures remain uneven because the last several years included significant losses and balance sheet strain. Valuation multiples are also elevated versus the sector on earnings and book value, so the market is already assigning a meaningful recovery premium.
Growth
Illumina operates in a sector with solid long-term structural support. DNA sequencing continues to expand across academic research, biopharma development, cancer testing, rare disease analysis, reproductive screening, and large-scale population health programs. The broader direction is favorable because sequencing costs have fallen over time, data interpretation tools keep improving, and medicine is becoming more personalized. That does not guarantee smooth yearly growth, but it does support the relevance of Illumina’s core technology over a long horizon.
The company’s strategy also makes industrial sense. A large installed base can create recurring demand for consumables, and that recurring stream is usually more stable than instrument sales alone. If Illumina can keep customers on its platforms while launching more capable systems, it can benefit from both new equipment placements and higher usage per machine. The most important commercial objective is therefore not just selling boxes, but increasing sequencing activity across the installed base.
Recent revenue trends suggest the company has moved out of a softer period and back into moderate expansion. Year-over-year growth was negative through much of 2024 and parts of 2025, but the latest readings show a return to positive mid-single-digit to high-single-digit growth. That is encouraging because it suggests demand is improving rather than simply profitability being lifted by cost cuts.
Cash generation has improved even more clearly than revenue. Free cash flow moved from weak or negative levels earlier in the cycle to roughly $1.0 billion on a trailing basis. For a long-term business assessment, that matters because cash flow tends to be harder to engineer than adjusted earnings. It gives Illumina more flexibility to fund research, support new product launches, manage debt, and absorb market slowdowns.
Potential catalysts are tied to product cycles and the expanding use of genomics in healthcare. Illumina’s newer high-throughput platforms, broader clinical adoption of sequencing, and rising demand from oncology and multiomics workflows could all support higher utilization. A second catalyst is operational normalization: once a company moves from unusual strategic disruption back toward a cleaner cost structure, margin recovery can be meaningful even without dramatic revenue acceleration.
Recent company communications have also pointed to continued execution around its sequencing roadmap and customer demand trends. For Illumina, the most significant opportunity is not a completely new market appearing overnight, but the steady deepening of sequencing across research and clinical settings where the company already has strong presence.
Risks
This article is for informational purposes only and does not constitute financial advice. Some content is AI-generated. See Disclaimer


