Stock Analysis · IHS Holding Ltd (IHS)
Overview
IHS Holding Ltd operates shared telecommunications infrastructure, mainly mobile phone towers, across several emerging markets, with its largest presence in Africa. Instead of selling mobile service directly to consumers, the company leases space on its towers to mobile network operators, internet providers, and other communications customers. This is generally a recurring-revenue business: once a tower is built, additional tenants can be added with relatively limited incremental cost, which can support strong operating margins when sites remain active and well utilized.
The business is centered on tower leasing, but reported revenue is also shaped by power management, colocation, and related services that help tenants keep networks running in markets where grid reliability can be weak. Based on recent annual reporting, the main revenue sources can be summarized as follows:
- Nigeria tower operations: approximately 58% to 60% of revenue. This is the company’s largest market by far and includes lease income and power-related services provided to tenants.
- Sub-Saharan Africa outside Nigeria including markets such as Cameroon, Côte d’Ivoire, Rwanda, Zambia, and South Africa: approximately 30% to 32% of revenue combined, depending on period and currency effects.
- Latin America and Middle East operations including Brazil and other smaller markets: approximately 8% to 12% of revenue combined.
- Other revenue streams: a small contribution from services tied to site build-outs, fiber or in-building solutions, and non-lease items where applicable.
The broad financial pattern has been mixed but important: revenue expanded strongly through 2023, then fell in 2024, while gross profit remained comparatively resilient and profitability improved sharply in 2025. That suggests the business still has useful underlying economics, but also that headline results can swing significantly because of currency moves, impairments, financing costs, and one-off charges.
The flow of revenue to profit shows a business with solid gross profitability but historically heavy pressure from operating charges and interest expense. The major positive change is the return to positive net income in 2025 after several deeply loss-making years, helped by much better operating income and lower financing drag.
Key Figures
| Metric | Value | Sector ⓘ |
|---|---|---|
| Date | Oct 03, 2026 | |
| Context | ||
| Sector | Real Estate | |
| Industry | Real Estate Services | |
| Market Cap ⓘ | $2.83B | |
| Beta ⓘ | 0.74 | |
Value (Cheapness) | ||
| P/E Ratio ⓘ | 5.13 | 17.35 |
| P/B Ratio ⓘ | N/A | 0.86 |
| FCF Yield ⓘ | 18.94% | 7.47% |
| Dividend Yield ⓘ | N/A | 4.75% |
| EBIT / EV ⓘ | 16.86% | 3.81% |
| PEG ⓘ | N/A | |
Growth (Business expansion) | ||
| Revenue Growth ⓘ | 10.40% | 5.30% |
| RPS Growth (5Y CAGR) ⓘ | -0.99% | 5.96% |
| EPS Growth (5Y CAGR) ⓘ | N/A | -11.41% |
| BVPS Growth (5Y CAGR) ⓘ | N/A | 0.41% |
| Margin Growth (5Y Trend) ⓘ | N/A | 0.53% |
| FCF Growth (5Y CAGR) ⓘ | 4.68% | 5.40% |
| DPS Growth (5Y CAGR) ⓘ | N/A | 5.02% |
Quality (Business durability) | ||
| ROIC (Latest) ⓘ | 20.95% | 5.77% |
| ROE (Latest) ⓘ | N/A | 7.64% |
| ROA (Latest) ⓘ | 3.14% | 2.85% |
| ROIC (5Y Median) ⓘ | -3.89% | 4.20% |
| ROE (5Y Median) ⓘ | -37.96% | 6.03% |
| ROA (5Y Median) ⓘ | -7.74% | 2.45% |
| Net Debt / EBIT (Latest) ⓘ | 2.72 | 7.57 |
| Net Debt / EBIT (5Y Median) ⓘ | N/A | 8.41 |
| Net Debt / EBITDA (Latest) ⓘ | 2.03 | 5.12 |
| Net Debt / Assets ⓘ | 55.42% | 37.84% |
| EBITDA / Interest ⓘ | 4.27 | 4.11 |
| Operating Margin (Latest) ⓘ | 57.23% | 35.40% |
| Operating Margin (5Y Median) ⓘ | -11.03% | 36.59% |
| Debt to Equity (Latest) ⓘ | -1920.58% | 89.06% |
| Profit Margin (Latest) ⓘ | 8.64% | 19.99% |
| Free Cash Flow (Latest) ⓘ | $535.82M | |
Momentum (Price trend) | ||
| 3Y Return ⓘ | +54.06% | +30.60% |
| 12M Return (excl. last month) ⓘ | +15.86% | +7.55% |
| 6M Return ⓘ | +1.21% | +0.69% |
| Price vs. 200-Day MA ⓘ | +2.52% | -2.30% |
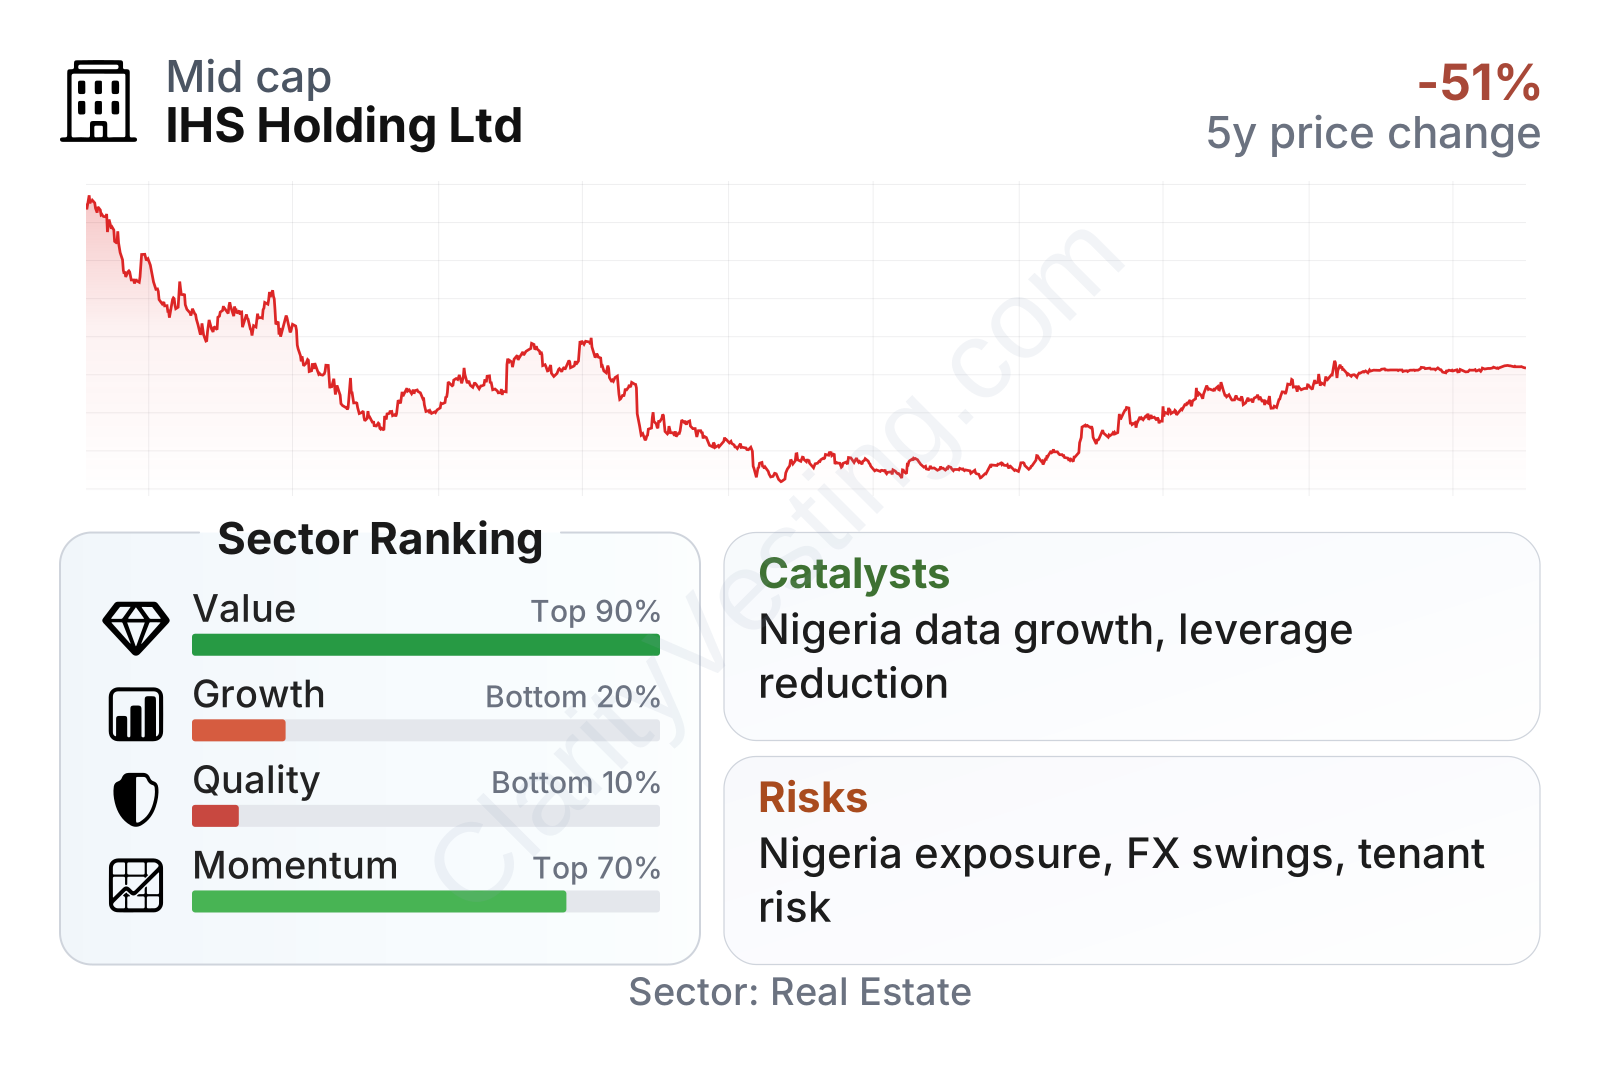
IHS is a mid-sized listed infrastructure company with a stock that has been highly volatile since its 2021 listing. After a steep decline through 2024, the shares recovered meaningfully into 2025 and 2026, but they still reflect a business the market treats as higher risk than a typical mature real estate name. The metrics table points to an unusual mix: very strong value scores and decent market momentum, but weak long-term quality and growth rankings relative to the sector. In simple terms, the market is assigning a low earnings multiple and a high free cash flow yield, yet it is also discounting the company for its uneven multi-year record, balance-sheet stress history, and concentration in tougher operating geographies.
The quality section also needs careful interpretation. Current profitability measures such as operating margin and return on invested capital look strong, and leverage versus EBITDA has improved materially. However, five-year averages remain poor because earlier losses were severe. That gap between current improvement and weak historical averages is central to understanding the company today.
Growth
IHS operates in a sector with favorable long-term demand drivers. Mobile data use continues to rise, 4G coverage is still expanding in many of its markets, and 5G will eventually require denser infrastructure in selected urban areas. In countries where network quality is inconsistent and operators prefer to avoid owning every tower themselves, independent tower companies can play an important role. That general industry direction is supportive, especially in underpenetrated emerging markets where population growth and smartphone adoption remain meaningful structural tailwinds.
IHS’s strategy also makes industrial sense. Shared tower infrastructure can become more valuable as more tenants are added to existing sites, because a second or third customer usually improves economics more than the first one. The company has also focused on power management and site reliability, which matters in markets where electricity and diesel logistics are not trivial issues. Those operational capabilities can make the platform harder to replicate than a simple real estate lease model.
Even so, the growth record is not straightforward. Revenue per share climbed from 2021 to 2023, then moved lower in 2024 and 2025. That suggests the underlying demand opportunity is real, but translation into shareholder-level growth has been disrupted by currency depreciation, portfolio changes, and operational resets. Recent year-over-year revenue growth still looks better than the sector median, yet the five-year revenue-per-share trend remains weak, which is why the growth profile ranks low overall.
The company does not currently return cash through dividends, and it has not paid one in recent years. For a business with sizable debt obligations and periodic restructuring needs, retaining cash rather than distributing it is consistent with the current stage of the company’s balance-sheet repair and operating repositioning.
A notable catalyst is the sharper improvement seen in 2025 profitability and free cash flow generation. Free cash flow remains substantial relative to the company’s market value, and net debt relative to EBITDA has come down significantly from stressed levels. If those gains prove durable, they could support further refinancing flexibility, lower interest burden over time, and a more stable earnings profile. Recent company updates have also emphasized selective capital allocation, cost discipline, and focus on higher-return markets rather than expansion at any price, which is a healthier stance for a long-duration infrastructure operator.
Risks
This article is for informational purposes only and does not constitute financial advice. Some content is AI-generated. See Disclaimer


