Stock Analysis · International General Insurance Holdings Ltd (IGIC)
Overview
International General Insurance Holdings Ltd is a specialty insurer and reinsurer. In simple terms, it underwrites risks that are often more complex or less standardized than typical personal insurance lines such as auto or home coverage. Its business is focused on commercial clients, and it operates across regions including the Middle East, North Africa, Europe, Asia, and the Americas. The group writes policies both directly and through reinsurance, meaning it can insure end customers or take on part of the risk originally written by other insurers.
The company’s revenue mainly comes from underwriting income tied to gross written premiums and from investment income generated by its portfolio of bonds, cash, and other invested assets. Based on the company’s recent annual reporting structure, the main operating revenue sources are broadly ranked as follows:
- Short-tail specialty insurance and reinsurance lines — the largest revenue source. This includes areas such as energy, property, engineering, marine, and certain liability-related risks. These lines generally produce the majority of premiums because they are core to IGIC’s underwriting platform.
- Long-tail specialty lines — a smaller but still meaningful source. This typically includes casualty and financial lines, where claims can take longer to emerge and settle.
- Investment income — a meaningful supporting source of earnings rather than premium revenue. For insurers, this often contributes a mid-teens share of total pre-tax earnings in favorable rate environments, although the exact mix can shift from year to year.
Because IGIC reports by underwriting classes rather than a simple consumer-style product menu, exact percentages by source can vary each year and are not always directly comparable on a single line-item basis. What is clear is that underwriting remains the dominant economic engine, with invested assets adding an important second layer of profitability. Over the last several years, total revenue and net income have both trended higher, showing that premium growth has not come at the expense of overall profitability.
The business has expanded its top line materially since 2021, while operating income and net income also improved strongly through 2024. The 2025 revenue picture appears flatter than 2024, but earnings remained solid, suggesting the company has been prioritizing underwriting discipline rather than chasing volume at any price.
Key Figures
| Metric | Value | Sector ⓘ |
|---|---|---|
| Date | Oct 17, 2026 | |
| Context | ||
| Sector | Financial Services | |
| Industry | Insurance - Diversified | |
| Market Cap ⓘ | $1.02B | |
| Beta ⓘ | 0.08 | |
Value (Cheapness) | ||
| P/E Ratio ⓘ | 9.69 | 12.26 |
| P/B Ratio ⓘ | 1.56 | 1.23 |
| FCF Yield ⓘ | 10.96% | 10.40% |
| Dividend Yield ⓘ | 1.43% | 3.02% |
| EBIT / EV ⓘ | N/A | 8.14% |
| PEG ⓘ | N/A | |
Growth (Business expansion) | ||
| Revenue Growth ⓘ | 8.00% | 9.35% |
| RPS Growth (5Y CAGR) ⓘ | 11.57% | 12.19% |
| EPS Growth (5Y CAGR) ⓘ | -15.97% | -9.53% |
| BVPS Growth (5Y CAGR) ⓘ | 16.45% | 4.99% |
| Margin Growth (5Y Trend) ⓘ | 11.42% | -3.86% |
| FCF Growth (5Y CAGR) ⓘ | -4.23% | 4.81% |
| DPS Growth (5Y CAGR) ⓘ | 31.43% | 8.79% |
Quality (Business durability) | ||
| ROIC (Latest) ⓘ | N/A | 9.49% |
| ROE (Latest) ⓘ | 15.99% | 13.90% |
| ROA (Latest) ⓘ | 5.04% | 1.55% |
| ROIC (5Y Median) ⓘ | 20.46% | 7.86% |
| ROE (5Y Median) ⓘ | 19.44% | 12.17% |
| ROA (5Y Median) ⓘ | 6.15% | 1.30% |
| Net Debt / EBIT (Latest) ⓘ | N/A | 0.96 |
| Net Debt / EBIT (5Y Median) ⓘ | -1.46 | 0.73 |
| Net Debt / EBITDA (Latest) ⓘ | -1.85 | 0.92 |
| Operating Margin (Latest) ⓘ | N/A | 22.30% |
| Operating Margin (5Y Median) ⓘ | 24.62% | 24.63% |
| Debt to Equity (Latest) ⓘ | N/A | 58.56% |
| Profit Margin (Latest) ⓘ | 20.65% | 26.57% |
| Free Cash Flow (Latest) ⓘ | $112.35M | |
Momentum (Price trend) | ||
| 3Y Return ⓘ | +158.84% | +88.33% |
| 12M Return (excl. last month) ⓘ | +12.32% | +19.38% |
| 6M Return ⓘ | -5.20% | +4.75% |
| Price vs. 200-Day MA ⓘ | -2.44% | +3.50% |
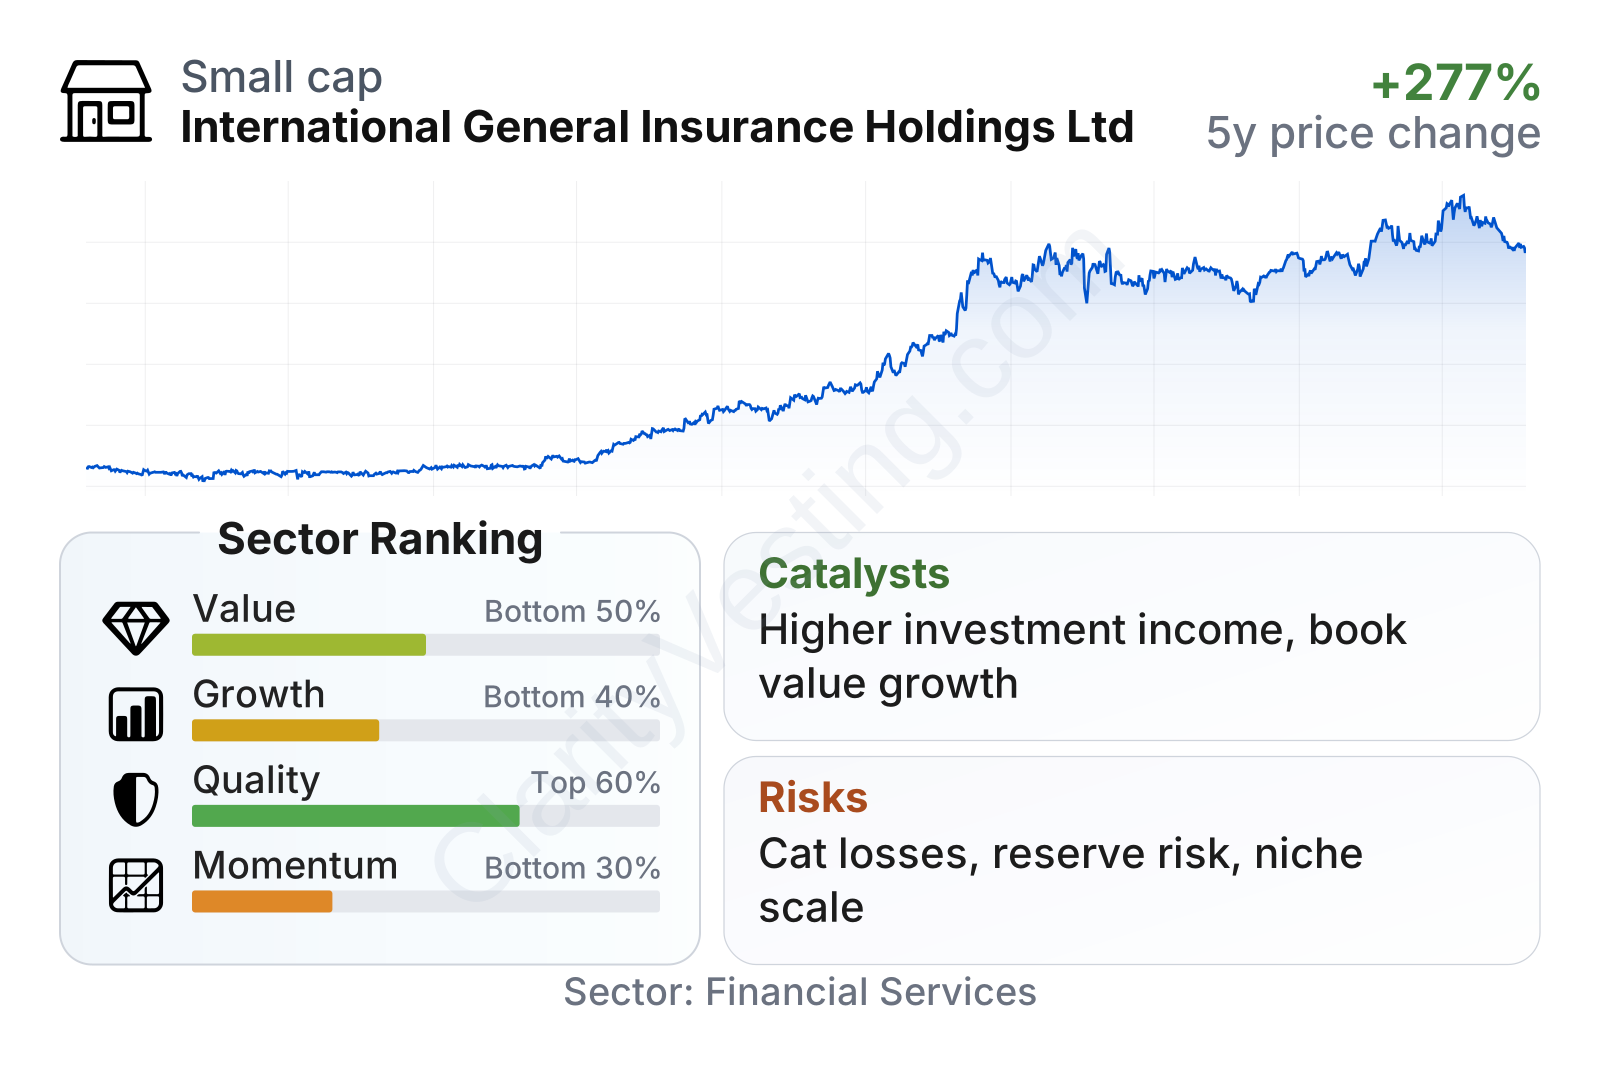
IGIC is a relatively small listed insurer with a market value around $1.0 billion, and its share-price volatility has been unusually low, with a beta near 0.1. The metrics show a mixed but generally solid profile: valuation based on earnings looks below the sector median, quality measures are above average, and growth is more uneven. Profitability ratios remain strong for an insurer, while recent price momentum has cooled after a very strong multiyear run in the stock.
The stock chart shows a major re-rating since late 2023. That move has been supported by higher earnings and book value, not just market enthusiasm. Even so, after such a large advance, the market is no longer valuing IGIC like an overlooked deep discount insurer.
Growth
IGIC operates in a part of insurance that still has room for disciplined growth. Specialty commercial insurance and reinsurance can benefit from rising insured values, ongoing demand for complex risk transfer, and periodic tightening in market pricing after industry loss events. That does not make growth automatic, but it does mean a focused underwriter can expand profitably when competitors pull back or when clients need specialized capacity.
The company’s strategy appears coherent for long-term expansion. Management has emphasized specialty underwriting, geographic diversification, and capital strength rather than pursuing scale for its own sake. For a smaller insurer, this matters: growth in this industry only creates value if claims stay controlled and reserves remain adequate. IGIC’s book value per share has risen strongly over five years, well ahead of the sector median, which suggests that earnings have translated into tangible shareholder capital rather than being offset by weak underwriting or balance-sheet strain.
Earnings per share rose sharply from 2021 through 2024, then eased in 2025. That pattern is not unusual in insurance, where results can move around with catastrophe losses, reserve development, and investment conditions. The more important point for long-term analysis is that the company has moved to a meaningfully higher earnings base than it had a few years ago.
Book value per share has shown a strong upward trend, which is especially important for insurers because book value is a core measure of capital accumulation. This steady increase indicates that the company has been compounding value even through a business cycle that included inflation, interest-rate changes, and volatile claims conditions.
A current catalyst is the higher-interest-rate environment compared with the years before 2022. Insurers with conservatively invested portfolios can earn more on new money and reinvested assets, supporting investment income. Another potential growth driver is continued demand for specialty coverage in energy, marine, engineering, and political-risk-sensitive regions where underwriting expertise can command better pricing than commodity-like insurance products.
Risks
This article is for informational purposes only and does not constitute financial advice. Some content is AI-generated. See Disclaimer


