Stock Analysis · IES Holdings Inc (IESC)
Overview
IES Holdings Inc is a specialty contractor and infrastructure services company. It designs, builds, installs, and maintains electrical and technology systems used in data centers, homes, commercial buildings, industrial facilities, and communications networks. In simple terms, the company is hired when a customer needs critical building systems put in place correctly, especially projects that require technical know-how rather than basic construction labor.
The business is organized into four main operating segments. Based on the latest annual filing for fiscal 2025, revenue sources rank as follows:
- Communications: approximately 34% of revenue. This segment provides network infrastructure, data center installation, structured cabling, audio-visual, security, and related technology services.
- Residential: approximately 29% of revenue. This business installs electrical systems and low-voltage products in single-family and multifamily housing developments.
- Infrastructure Solutions: approximately 21% of revenue. This includes electrical and mechanical solutions for industrial customers, rail and transportation work, and custom power products.
- Commercial & Industrial: approximately 16% of revenue. This segment handles electrical contracting and maintenance for commercial buildings, industrial facilities, and institutional projects.
That mix matters because it gives IES exposure to several end markets at once. Residential construction can be cyclical, but communications and infrastructure work can benefit from longer-term investment themes such as data centers, electrification, and industrial modernization.
Another notable feature is margin improvement. Over the last several years, revenue has grown steadily, but profit has grown even faster. That suggests the company is not only getting bigger, it is also becoming more efficient and taking on more attractive work.
The long-term pattern shows a meaningful rise in gross profit and operating income, not just sales. In other words, more of each revenue dollar has been reaching the bottom line than it did a few years ago.
Key Figures
| Metric | Value | Sector ⓘ |
|---|---|---|
| Date | Oct 24, 2026 | |
| Context | ||
| Sector | Industrials | |
| Industry | Engineering & Construction | |
| Market Cap ⓘ | $10.23B | |
| Beta ⓘ | 1.77 | |
Value (Cheapness) | ||
| P/E Ratio ⓘ | 21.45 | 22.29 |
| P/B Ratio ⓘ | 7.81 | 1.98 |
| FCF Yield ⓘ | 2.23% | 6.26% |
| Dividend Yield ⓘ | N/A | 1.92% |
| EBIT / EV ⓘ | 4.46% | 4.83% |
| PEG ⓘ | N/A | |
Growth (Business expansion) | ||
| Revenue Growth ⓘ | 39.60% | 9.30% |
| RPS Growth (5Y CAGR) ⓘ | 23.05% | 7.76% |
| EPS Growth (5Y CAGR) ⓘ | 70.46% | -13.17% |
| BVPS Growth (5Y CAGR) ⓘ | 30.05% | 6.13% |
| Margin Growth (5Y Trend) ⓘ | 6.13% | 0.74% |
| FCF Growth (5Y CAGR) ⓘ | 63.67% | 10.79% |
| DPS Growth (5Y CAGR) ⓘ | -65.61% | 9.41% |
Quality (Business durability) | ||
| ROIC (Latest) ⓘ | 40.61% | 10.75% |
| ROA (Latest) ⓘ | 23.57% | 5.41% |
| ROIC (5Y Median) ⓘ | 27.34% | 9.37% |
| ROA (5Y Median) ⓘ | 11.30% | 4.95% |
| Net Debt / EBIT (Latest) ⓘ | -0.00 | 2.04 |
| Net Debt / EBIT (5Y Median) ⓘ | 0.08 | 2.27 |
| Net Debt / EBITDA (Latest) ⓘ | -0.00 | 1.39 |
| Net Debt / Assets ⓘ | -0.01% | 19.27% |
| EBITDA / Interest ⓘ | 184.62 | 9.58 |
| Operating Margin (Latest) ⓘ | 13.91% | 10.49% |
| Operating Margin (5Y Median) ⓘ | 6.80% | 10.30% |
| Debt to Equity (Latest) ⓘ | 6.26% | 64.82% |
| Profit Margin (Latest) ⓘ | 11.44% | 6.67% |
| Free Cash Flow (Latest) ⓘ | $228.40M | |
Momentum (Price trend) | ||
| 3Y Return ⓘ | +676.92% | +67.77% |
| 12M Return (excl. last month) ⓘ | +69.57% | +12.05% |
| 6M Return ⓘ | -16.12% | 0.00% |
| Price vs. 200-Day MA ⓘ | -19.90% | +0.67% |
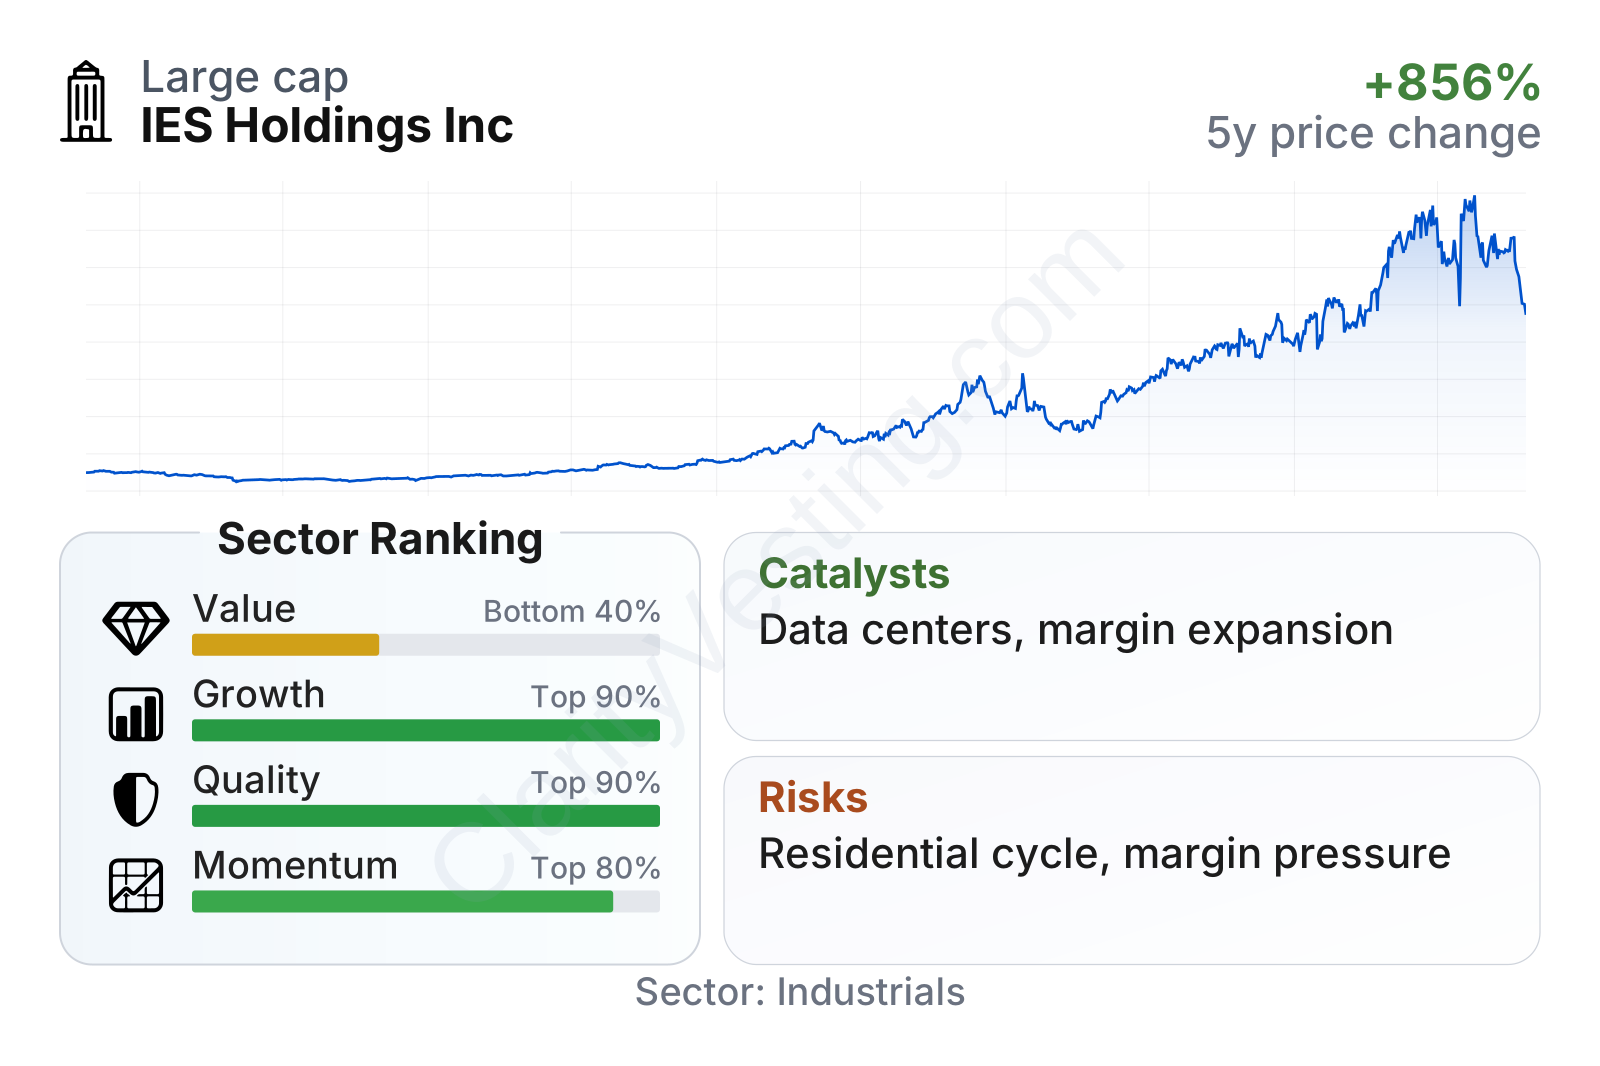
IES is now a large company by market value, but its operating profile still looks unusually strong for a contractor. Growth, profitability, and balance-sheet quality rank near the top of the industrial peer group. Return on invested capital is far above the sector median, debt is very low, and cash generation has improved sharply. The weaker area is valuation: the shares trade above the sector median on earnings and far above it on book value, so the market is already recognizing much of this operational strength.
Growth
IES operates in several areas that are supported by durable long-term demand. The most important is data center and communications infrastructure, where rising computing needs, cloud expansion, and artificial intelligence workloads are driving heavy spending on power, cabling, and related systems. The company is also tied to electrification trends and to ongoing demand for specialized building systems in industrial and commercial projects.
The company’s strategy appears sensible because it focuses on technical niches where execution matters and customers often value reliability over the lowest price. That can support better margins than commodity-style contracting. IES has also expanded through a decentralized model, allowing business units to stay close to customers while benefiting from the group’s scale and capital discipline.
Revenue growth has remained strong, and the latest year-over-year reading is well above the sector median. The pace has not been perfectly linear, but the broader trend shows that IES has been able to keep winning work across multiple end markets.
Cash generation has been especially encouraging. Free cash flow has moved from negative territory a few years ago to a solid positive level, which is important because accounting earnings in contracting businesses can sometimes look better than cash flow. Here, both have been improving together.
A recent and important catalyst is the continued buildout of data center capacity in the United States. IES has repeatedly highlighted strong activity in communications and infrastructure-related work in its company disclosures, and those areas are directly connected to high-growth digital infrastructure spending. If that investment cycle stays active, it could continue to support backlog, revenue, and margins.
Risks
This article is for informational purposes only and does not constitute financial advice. Some content is AI-generated. See Disclaimer