Stock Analysis · Icahn Enterprises LP (IEP)
Overview
Icahn Enterprises LP is a diversified holding company controlled by Carl Icahn. Rather than operating as a single industrial business, it owns and manages a collection of subsidiaries across several industries and also maintains an investment segment that takes positions in publicly traded securities. That structure makes Icahn Enterprises different from a typical refining company, even though energy is currently one of its most important operating exposures.
Its revenue comes mainly from operating businesses, with the investment segment contributing more through gains, losses, and cash distributions over time than through recurring sales. Based on recent annual reporting, the largest revenue sources are approximately:
- Energy – about 69%: Primarily petroleum refining, marketing of gasoline, diesel, jet fuel and other refined products, and related logistics activities through CVR Energy.
- Automotive – about 21%: Auto repair and maintenance services, parts distribution, and related aftermarket activities through the automotive service network.
- Food Packaging – about 5%: Production of packaging used mainly for foodservice and consumer applications.
- Real Estate, Home Fashion, Pharma, and other operating segments – about 5% combined: Smaller businesses that add diversification but currently represent a limited share of total sales.
- Investment segment – not a stable revenue line: This segment can materially affect earnings and cash generation through market gains, dividends, and realized investment results, but it does not behave like ordinary operating revenue.
This mix shows that Icahn Enterprises is best understood as a conglomerate with a large energy engine, supported by automotive services and a set of smaller businesses. Over the past several years, total revenue has trended down from the 2022 peak, while interest expense has remained heavy. That combination helps explain why positive gross profit has not consistently translated into positive net income.
The business still produces large gross profit in dollar terms, but a meaningful share has been absorbed by overhead, subsidiary-level weakness, and financing costs. That makes segment quality and balance sheet strength especially important when assessing the company over a long horizon.
Key Figures
| Metric | Value | Sector ⓘ |
|---|---|---|
| Date | Oct 17, 2026 | |
| Context | ||
| Sector | Energy | |
| Industry | Oil & Gas Refining & Marketing | |
| Market Cap ⓘ | $4.77B | |
| Beta ⓘ | 0.70 | |
Value (Cheapness) | ||
| P/E Ratio ⓘ | N/A | 15.44 |
| P/B Ratio ⓘ | 6.57 | 1.73 |
| FCF Yield ⓘ | -5.12% | 8.20% |
| Dividend Yield ⓘ | 30.26% | 3.59% |
| EBIT / EV ⓘ | -2.23% | 7.46% |
| PEG ⓘ | 1.15 | |
Growth (Business expansion) | ||
| Revenue Growth ⓘ | 25.70% | 26.90% |
| RPS Growth (5Y CAGR) ⓘ | -23.30% | 6.90% |
| EPS Growth (5Y CAGR) ⓘ | N/A | -15.73% |
| BVPS Growth (5Y CAGR) ⓘ | -39.85% | 6.07% |
| Margin Growth (5Y Trend) ⓘ | 0.97% | 0.58% |
| FCF Growth (5Y CAGR) ⓘ | N/A | 1.86% |
| DPS Growth (5Y CAGR) ⓘ | -0.71% | 16.79% |
Quality (Business durability) | ||
| ROIC (Latest) ⓘ | 1.18% | 11.40% |
| ROA (Latest) ⓘ | -3.73% | 6.06% |
| ROIC (5Y Median) ⓘ | -0.35% | 10.30% |
| ROA (5Y Median) ⓘ | -2.29% | 5.42% |
| Net Debt / EBIT (Latest) ⓘ | N/A | 1.64 |
| Net Debt / EBIT (5Y Median) ⓘ | 20.11 | 1.83 |
| Net Debt / EBITDA (Latest) ⓘ | 13.27 | 1.08 |
| Net Debt / Assets ⓘ | 41.80% | 17.29% |
| EBITDA / Interest ⓘ | 0.83 | 9.64 |
| Operating Margin (Latest) ⓘ | -1.81% | 16.27% |
| Operating Margin (5Y Median) ⓘ | 0.72% | 20.39% |
| Debt to Equity (Latest) ⓘ | 432.38% | 54.76% |
| Profit Margin (Latest) ⓘ | -4.96% | 8.82% |
| Free Cash Flow (Latest) ⓘ | -$244.00M | |
Momentum (Price trend) | ||
| 3Y Return ⓘ | -27.47% | +67.38% |
| 12M Return (excl. last month) ⓘ | +11.65% | +49.19% |
| 6M Return ⓘ | -1.52% | +7.07% |
| Price vs. 200-Day MA ⓘ | -2.37% | +9.56% |
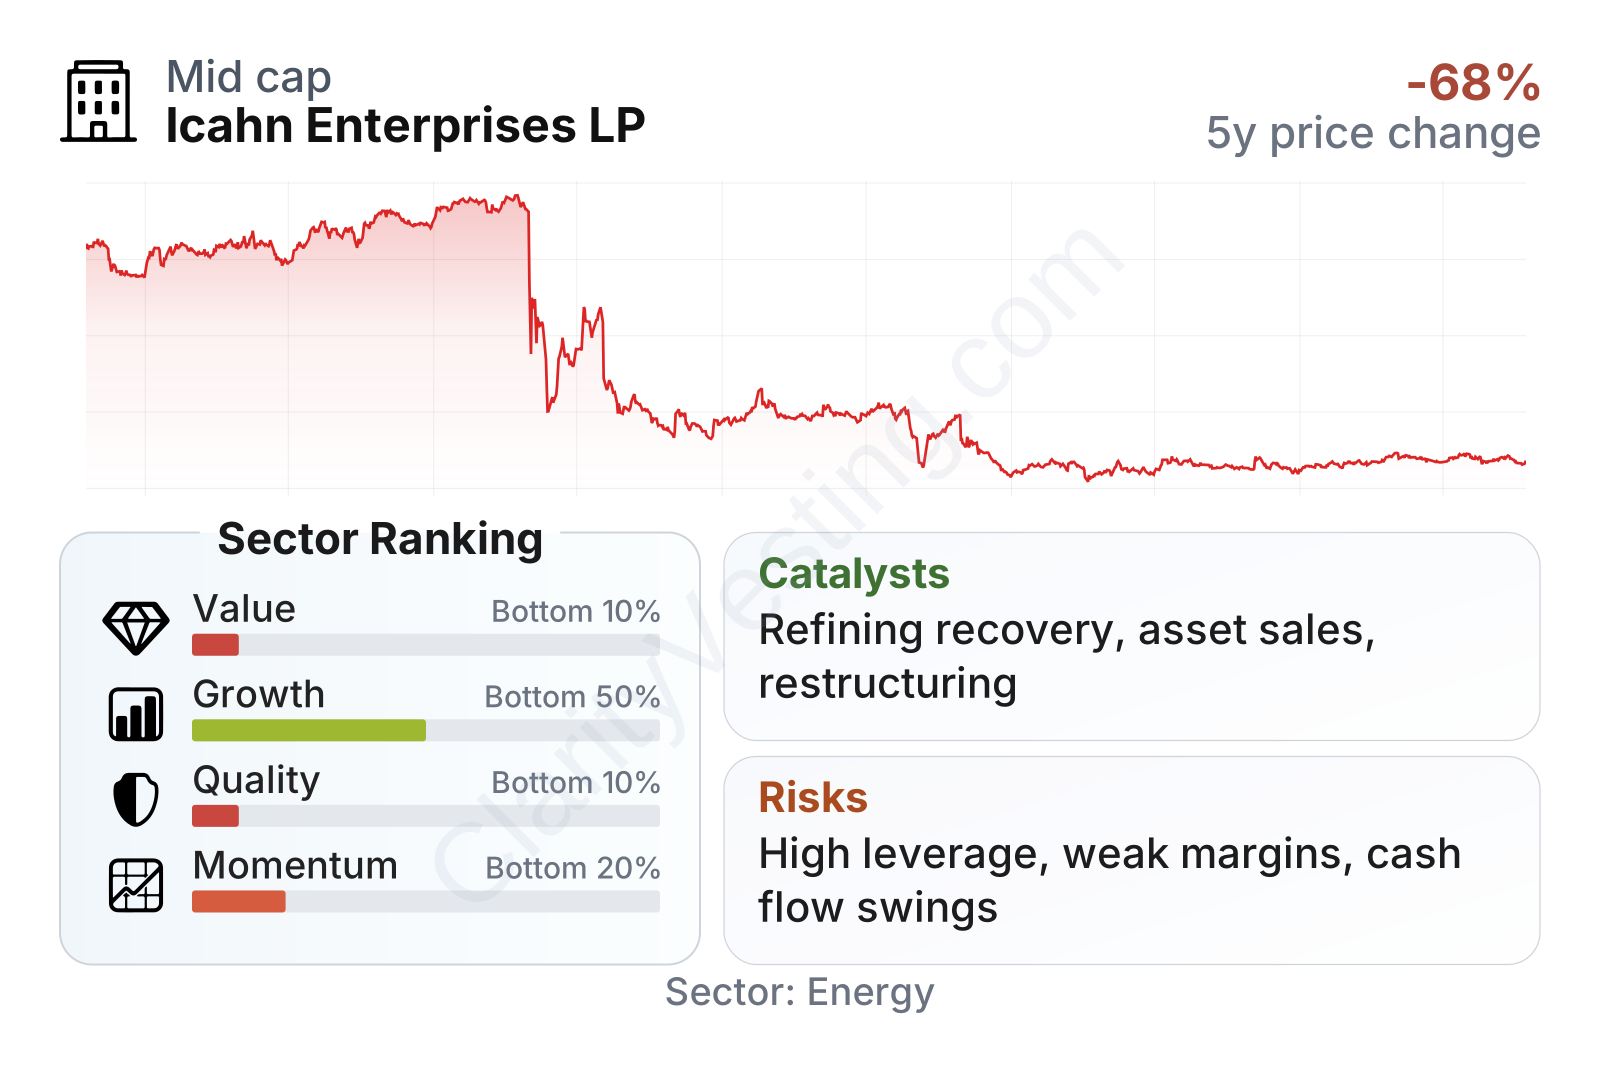
Icahn Enterprises is a mid-sized listed partnership with a low measured beta, but its operating profile is much weaker than that headline volatility number may suggest. The table points to a company ranking near the bottom of its sector on value, quality, and growth metrics. The very high trailing distribution yield stands out, but it sits alongside negative free cash flow yield, negative EBIT relative to enterprise value, weak returns on assets and invested capital, and leverage far above the sector norm. In other words, the income appeal is visible, but the underlying economics currently look strained.
The stock chart also shows a major reset since mid-2023. Shares have stabilized somewhat more recently, but they remain far below earlier levels, which reflects both operating pressure and reduced market confidence after the large repricing.
Growth
Icahn Enterprises operates in a mixed set of sectors. Energy refining can benefit from periods of strong fuel demand, favorable crack spreads, and tight product supply, but it is cyclical rather than structurally fast-growing. Automotive repair and maintenance is more defensive, since an aging vehicle fleet tends to support ongoing service demand. Packaging is steadier but usually not a high-growth market. As a result, the company’s long-term growth path depends less on secular expansion and more on capital allocation, operating improvements, and recovery in underperforming subsidiaries.
The current strategy still has logic on paper: own cash-generating assets, reshape weaker operations, and use an activist investing background to unlock value over time. The challenge is that this model works best when the underlying businesses are producing solid cash and when leverage is manageable. Recent trends show some improvement in top-line momentum, but the longer record remains uneven.
Revenue growth has turned positive again in the latest periods after a long stretch of declines. That is an encouraging sign because it suggests some stabilization in the operating base, particularly after several years of contraction. Even so, the five-year picture is still weak, so a short rebound alone does not yet establish a durable growth pattern.
Cash generation has also been volatile. Free cash flow swung sharply from positive to negative and back again, and the most recent trailing figure is again below zero. For a conglomerate that relies on capital flexibility, that inconsistency matters. A cleaner improvement in cash flow would be one of the clearest signs that operations are becoming more resilient.
A practical catalyst for future improvement is any sustained recovery at the energy segment, which remains the largest contributor to sales. Better refining margins, improved plant utilization, and stronger demand for transportation fuels could lift consolidated results. Additional catalysts could come from asset sales, restructuring steps, or balance sheet actions that simplify the group and reduce financing pressure. Recent company updates have continued to emphasize segment management and capital allocation discipline, but the central question is execution rather than ambition.
Risks
This article is for informational purposes only and does not constitute financial advice. Some content is AI-generated. See Disclaimer


