Stock Analysis · Ideaya Biosciences Inc (IDYA)
Overview
IDEAYA Biosciences is a clinical-stage biotechnology company focused on precision medicine in cancer. In simple terms, it tries to develop drugs for patient groups whose tumors have specific genetic weaknesses. Its research model is built around “synthetic lethality,” which means targeting a cancer cell’s particular DNA-repair or gene-related vulnerability while aiming to spare healthier cells. The company’s pipeline includes programs in MAT2A, Pol Theta, Werner helicase, and other oncology targets, and it has also used partnerships with larger pharmaceutical companies to expand development and validate its platform.
Because IDEAYA is still in the development stage, its revenue does not mainly come from selling approved medicines. Instead, revenue has largely come from collaboration and licensing arrangements, including upfront payments, milestone-related recognition, and research support from partners. Based on recent annual results, revenue appears concentrated in a small number of partnership-related sources rather than diversified commercial product sales.
- Collaboration and license revenue: approximately 100% of total revenue in recent periods. This generally includes payments recognized from strategic research and development partnerships, licensing access to drug candidates or platforms, and related milestone-based accounting.
- Product revenue: 0% based on current public filings, as the company does not yet have an approved product generating recurring commercial sales.
The business profile is therefore unusual compared with mature healthcare companies. The economic engine today is scientific progress, partnership execution, and clinical advancement rather than established drug sales. One notable financial pattern is that revenue has been volatile from year to year, while research spending has increased sharply as the pipeline has broadened and moved forward.
The operating structure remains research-heavy. Over the last several years, research and development expense has become the dominant use of cash, and losses have widened as IDEAYA invested more aggressively in trials and pipeline expansion. Revenue improved significantly in 2025, but spending still outweighed incoming partnership revenue.
Key Figures
| Metric | Value | Sector ⓘ |
|---|---|---|
| Date | Oct 24, 2026 | |
| Context | ||
| Sector | Healthcare | |
| Industry | Biotechnology | |
| Market Cap ⓘ | $3.42B | |
| Beta ⓘ | -0.04 | |
Value (Cheapness) | ||
| P/E Ratio ⓘ | N/A | 25.42 |
| P/B Ratio ⓘ | 2.77 | 3.08 |
| FCF Yield ⓘ | -3.33% | 3.12% |
| Dividend Yield ⓘ | N/A | 1.85% |
| EBIT / EV ⓘ | -6.57% | 0.56% |
| PEG ⓘ | N/A | |
Growth (Business expansion) | ||
| Revenue Growth ⓘ | 55.40% | 7.50% |
| RPS Growth (5Y CAGR) ⓘ | 32.89% | 8.60% |
| EPS Growth (5Y CAGR) ⓘ | N/A | -17.73% |
| BVPS Growth (5Y CAGR) ⓘ | 7.82% | 3.72% |
| Margin Growth (5Y Trend) ⓘ | N/A | -0.57% |
| FCF Growth (5Y CAGR) ⓘ | N/A | 0.96% |
| DPS Growth (5Y CAGR) ⓘ | N/A | 6.69% |
Quality (Business durability) | ||
| ROIC (Latest) ⓘ | -13.57% | 3.17% |
| ROA (Latest) ⓘ | -14.03% | 2.98% |
| ROIC (5Y Median) ⓘ | -15.69% | 4.56% |
| ROA (5Y Median) ⓘ | -14.25% | 1.87% |
| Net Debt / EBIT (Latest) ⓘ | N/A | 1.34 |
| Net Debt / EBIT (5Y Median) ⓘ | N/A | 1.86 |
| Net Debt / EBITDA (Latest) ⓘ | N/A | 1.00 |
| Net Debt / Assets ⓘ | -18.58% | 5.06% |
| EBITDA / Interest ⓘ | N/A | 9.55 |
| Operating Margin (Latest) ⓘ | -78.96% | 9.25% |
| Operating Margin (5Y Median) ⓘ | -179.91% | 7.33% |
| Debt to Equity (Latest) ⓘ | 2.44% | 26.68% |
| Profit Margin (Latest) ⓘ | -74.75% | 3.34% |
| Free Cash Flow (Latest) ⓘ | -$113.87M | |
Momentum (Price trend) | ||
| 3Y Return ⓘ | +35.33% | +51.61% |
| 12M Return (excl. last month) ⓘ | +53.20% | +19.90% |
| 6M Return ⓘ | +14.05% | +10.10% |
| Price vs. 200-Day MA ⓘ | +5.86% | +6.44% |
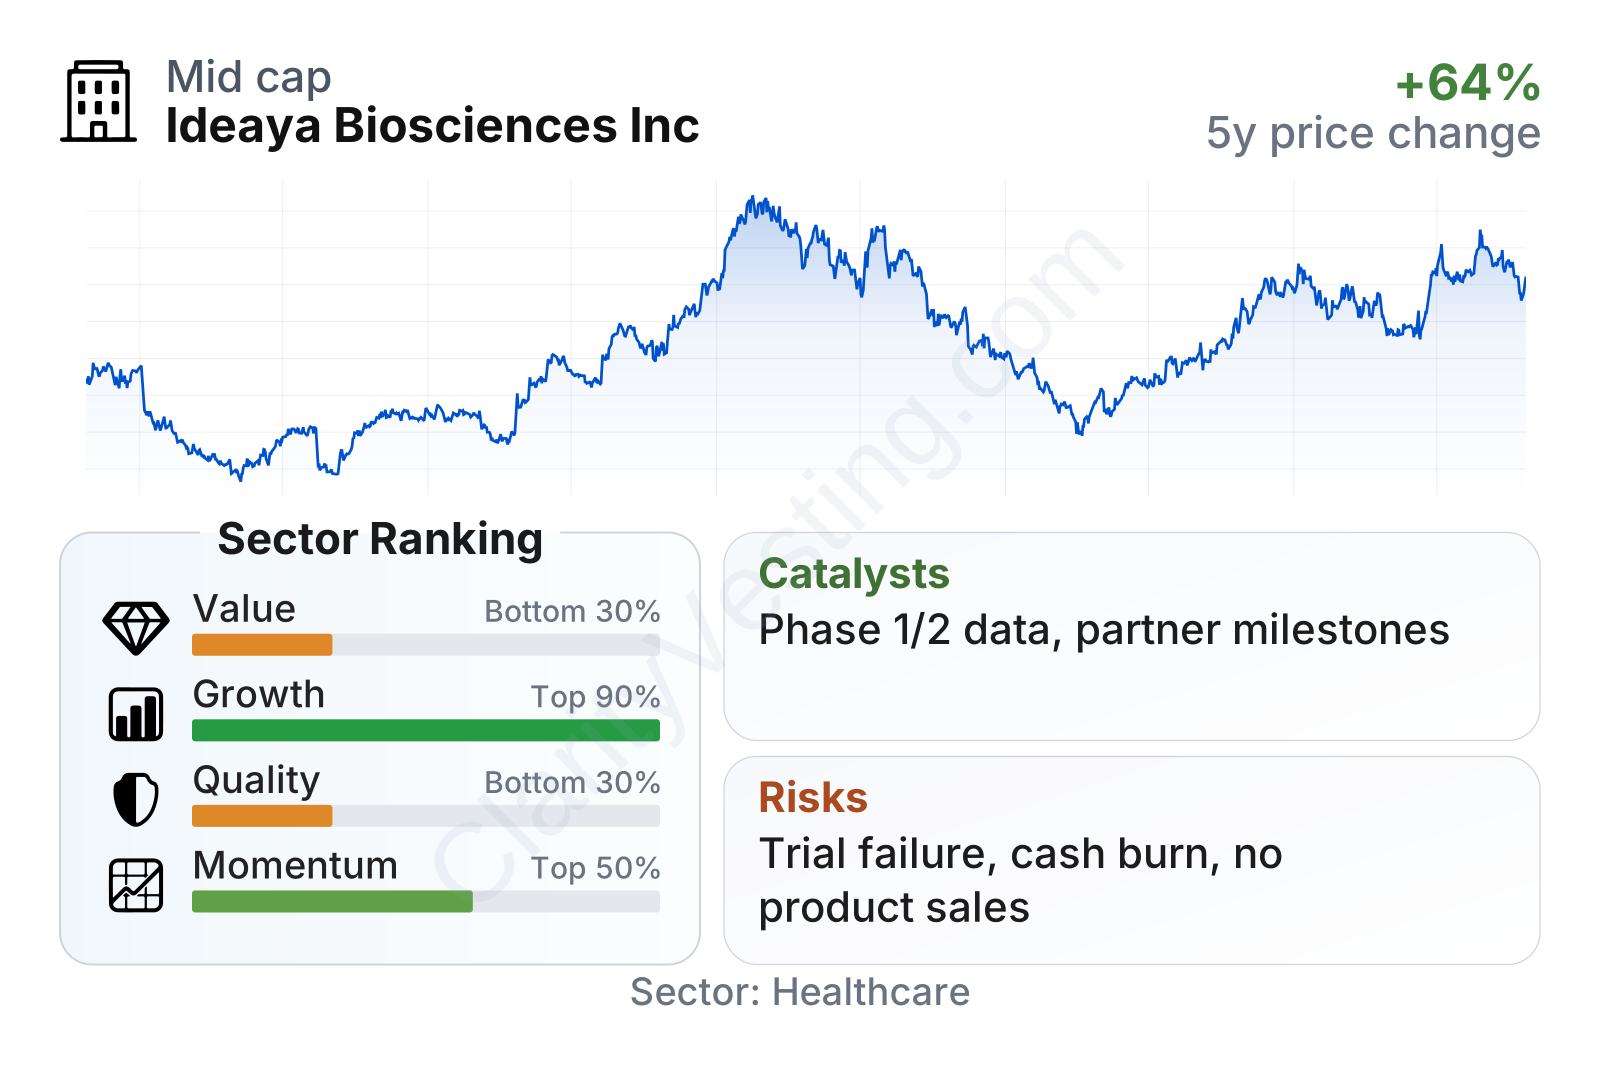
IDEAYA is a mid-sized biotech by market value, with a stock that has been highly volatile over the past several years, which is common for clinical-stage drug developers. The factor picture is mixed: growth metrics rank well above much of the healthcare sector, while value and quality metrics rank much lower. That combination usually reflects a company with meaningful pipeline expectations but limited current profitability.
The table also points to a balance sheet that is much less levered than the sector median, which is a positive feature for a business still consuming cash. On the other hand, profitability, returns on capital, and free cash flow remain clearly negative, showing that the company is still far from a self-funded operating model.
Growth
Biotechnology remains a structurally important growth area within healthcare, especially in oncology and precision medicine. Cancer treatment continues to move toward more targeted therapies, biomarker-defined patient populations, and combination approaches. IDEAYA’s strategy fits this direction well: rather than pursuing very broad indications first, it aims to identify genetically selected populations where response rates may be more compelling and development pathways may be more focused.
Its growth case depends less on near-term scale and more on whether its pipeline can generate strong clinical data. That is the central logic behind the company’s strategy. If targeted programs show convincing efficacy and safety in trials, the company could create value through later-stage development, licensing economics, or eventual commercialization. This is one reason larger pharmaceutical companies often partner with precision oncology specialists before products are approved.
Revenue growth has been uneven, which is normal for a company relying on collaboration accounting rather than product sales. Even so, the latest year-over-year growth rate is far above the healthcare sector median, and five-year revenue-per-share growth is also notably strong. The key point is that this growth is not the same as stable commercial expansion; it reflects business-development activity and milestone timing, so it should be treated as opportunistic rather than fully recurring.
Cash usage has also been an important moving piece. Free cash flow remained negative, but the most recent trailing period shows a much smaller cash outflow than the prior peak burn period. That suggests the company’s cash profile improved from the most intense spending phase, although it is still consuming capital overall. For a clinical-stage biotech, the question is not current cash generation but whether available resources are enough to carry key programs through major data readouts.
Recent company communications in 2026 continued to emphasize progress across its precision oncology pipeline and advancement of lead programs. The main potential catalysts are clinical trial updates, dose-expansion data, combination-study results, regulatory milestones, and any additional partnership activity. In this part of biotech, one positive data release can materially improve the perceived probability of future product revenue, while one weak readout can do the reverse just as quickly.
Risks
This article is for informational purposes only and does not constitute financial advice. Some content is AI-generated. See Disclaimer


