Stock Analysis · ICON PLC (ICLR)
Overview
ICON PLC is a contract research organization, often called a CRO. In simple terms, it helps pharmaceutical, biotechnology, medical device, and public health customers design, run, and analyze clinical trials and other research work needed to bring new treatments to market. Instead of developing its own drugs, ICON provides services and specialized expertise to companies that do.
The business is broad, but most of its revenue comes from outsourced research and development support across the drug development process. Following the acquisition of PRA Health Sciences, ICON became one of the larger global players in clinical research services, with capabilities spanning trial design, patient recruitment, data management, laboratory support, consulting, and commercial support services.
ICON reports its business as a single operating segment, so exact revenue by service line is not broken out in the same way as some diversified peers. Based on company descriptions of its offerings, the main revenue sources are best understood as follows:
- Clinical trial and development services: the large majority of revenue, likely well above 70%. This includes managing Phase I-IV trials, project management, site monitoring, data handling, biostatistics, and regulatory support.
- Laboratory and biomarker-related services: a meaningful but smaller share. This covers central laboratory work, sample testing, and related support used in trials.
- Consulting, commercialization, and other outsourced services: a smaller portion. This can include patient recruitment, market access support, real-world evidence work, and strategic consulting.
Geographically, the company serves clients globally, and its customer base is diversified across large pharmaceutical companies as well as smaller biotech firms. That mix matters because large pharma tends to provide steadier demand, while biotech can be more cyclical and sensitive to financing conditions.
The long-term appeal of this model is straightforward: as drug development becomes more complex, more expensive, and more global, many sponsors prefer to outsource more of the work rather than build every capability internally.
Over the last several years, revenue expanded sharply after the PRA acquisition and then stabilized around the low-$8 billion range. Profitability improved through 2024, but 2025 showed a clear drop in operating income and net income despite broadly stable revenue, which suggests pressure from project mix, utilization, pricing, or integration and operating costs rather than a demand collapse alone.
Key Figures
| Metric | Value | Sector ⓘ |
|---|---|---|
| Date | Oct 24, 2026 | |
| Context | ||
| Sector | Healthcare | |
| Industry | Diagnostics & Research | |
| Market Cap ⓘ | $14.29B | |
| Beta ⓘ | 1.24 | |
Value (Cheapness) | ||
| P/E Ratio ⓘ | 195.00 | 25.42 |
| P/B Ratio ⓘ | 1.53 | 3.08 |
| FCF Yield ⓘ | 6.28% | 3.12% |
| Dividend Yield ⓘ | N/A | 1.85% |
| EBIT / EV ⓘ | 2.56% | 0.56% |
| PEG ⓘ | 0.50 | |
Growth (Business expansion) | ||
| Revenue Growth ⓘ | 1.20% | 7.50% |
| RPS Growth (5Y CAGR) ⓘ | 6.73% | 8.60% |
| EPS Growth (5Y CAGR) ⓘ | -22.27% | -17.73% |
| BVPS Growth (5Y CAGR) ⓘ | -0.44% | 3.72% |
| Margin Growth (5Y Trend) ⓘ | -1.58% | -0.57% |
| FCF Growth (5Y CAGR) ⓘ | 4.05% | 0.96% |
| DPS Growth (5Y CAGR) ⓘ | N/A | 6.69% |
Quality (Business durability) | ||
| ROIC (Latest) ⓘ | 1.96% | 3.17% |
| ROA (Latest) ⓘ | 0.42% | 2.98% |
| ROIC (5Y Median) ⓘ | 5.35% | 4.56% |
| ROA (5Y Median) ⓘ | 2.92% | 1.87% |
| Net Debt / EBIT (Latest) ⓘ | 6.59 | 1.34 |
| Net Debt / EBIT (5Y Median) ⓘ | 5.69 | 1.86 |
| Net Debt / EBITDA (Latest) ⓘ | 3.34 | 1.00 |
| Net Debt / Assets ⓘ | 15.64% | 5.06% |
| EBITDA / Interest ⓘ | 4.11 | 9.55 |
| Operating Margin (Latest) ⓘ | 4.67% | 9.25% |
| Operating Margin (5Y Median) ⓘ | 10.30% | 7.33% |
| Debt to Equity (Latest) ⓘ | 37.25% | 26.68% |
| Profit Margin (Latest) ⓘ | 0.33% | 3.34% |
| Free Cash Flow (Latest) ⓘ | $898.30M | |
Momentum (Price trend) | ||
| 3Y Return ⓘ | -16.78% | +51.61% |
| 12M Return (excl. last month) ⓘ | -2.16% | +19.90% |
| 6M Return ⓘ | +60.64% | +10.10% |
| Price vs. 200-Day MA ⓘ | +27.49% | +6.44% |
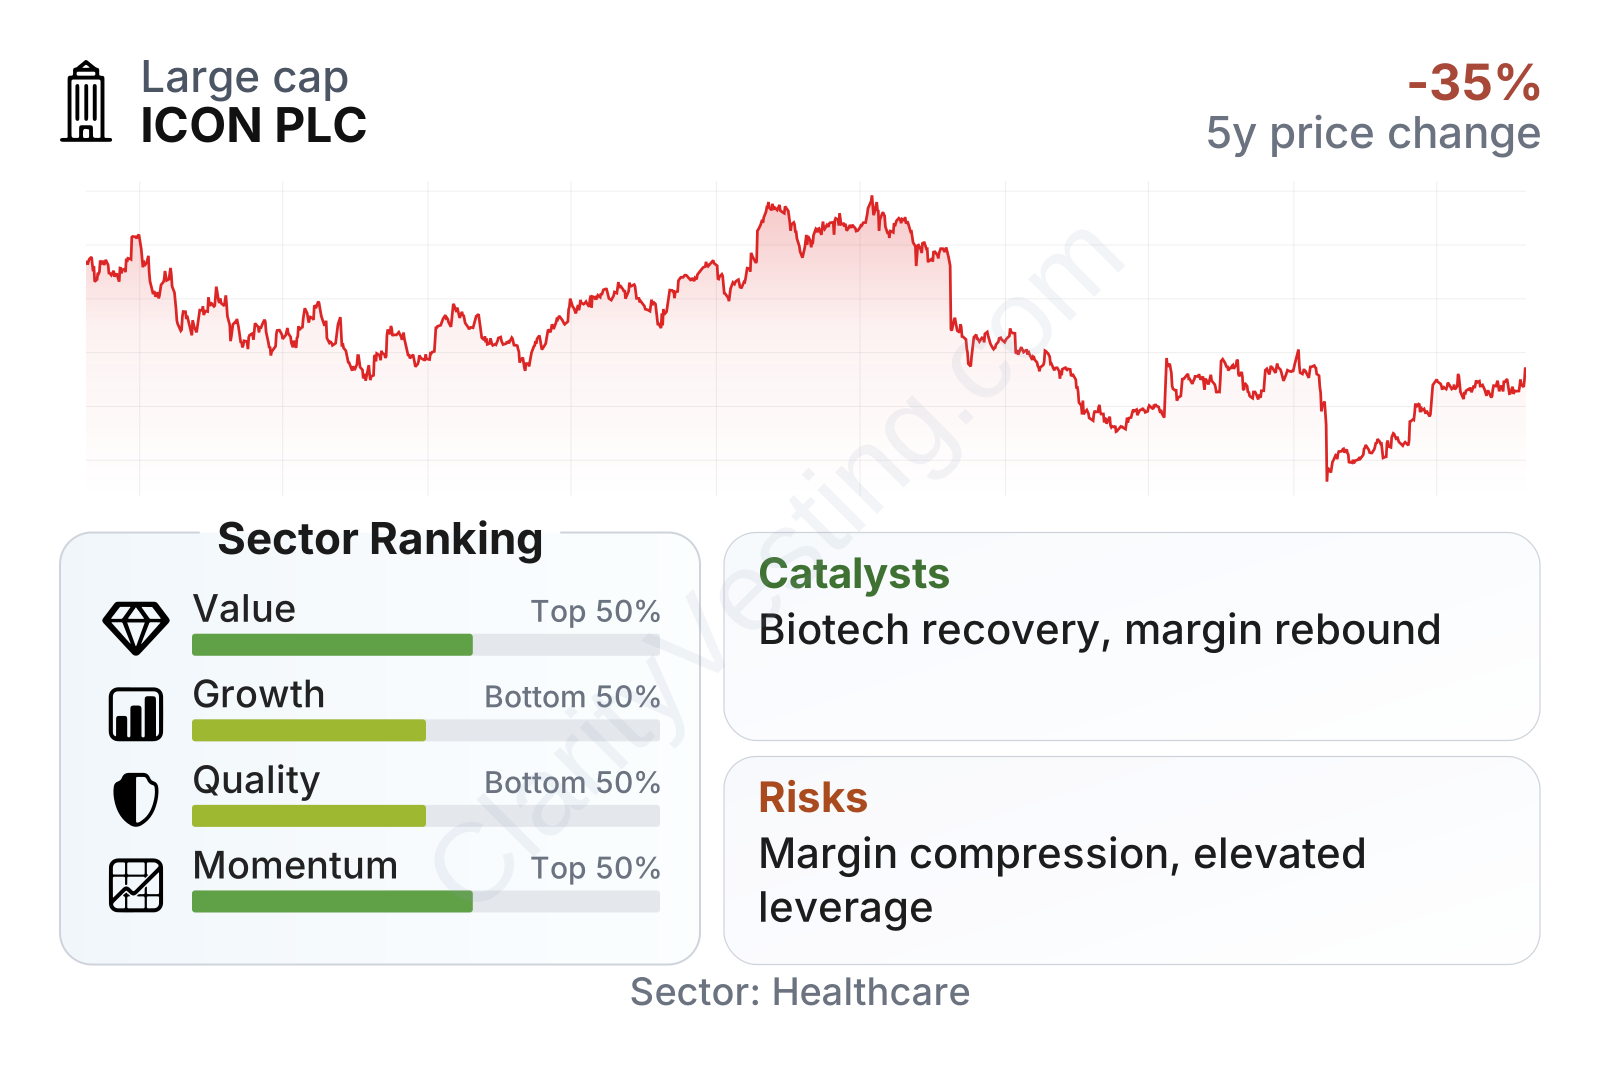
ICON is a large mid-cap to lower large-cap healthcare services company with a stock that has been volatile. The share price had a strong rebound in the most recent six months, but the longer three-year picture remains weak versus the broader healthcare research group. In the factor view, value metrics look better than the sector median in several areas, especially cash flow yield and enterprise-value-based earnings measures, while growth, quality, and momentum are less favorable overall. The biggest watchpoint in the table is the mismatch between healthy cash generation and very weak trailing earnings-based valuation metrics, which reflects pressure on recent net profit.
Growth
The sector itself has solid structural support. Drug developers continue to face rising trial complexity, larger data requirements, stricter regulation, and growing pressure to control fixed costs. Those conditions generally favor outsourcing to large CROs with global scale, established investigator networks, and the ability to run multinational trials. ICON is positioned directly in that trend.
Its strategy also makes industrial sense. Large pharmaceutical companies increasingly want fewer outsourcing partners that can manage bigger and more integrated programs across geographies. ICON’s broad platform, built further through PRA Health Sciences, fits that need. The company also has exposure to areas such as decentralized trial tools, real-world evidence, and data-driven trial design, which could support future demand as sponsors look for efficiency gains.
Recent growth, however, has been uneven. After very strong acquisition-driven expansion earlier in the period, annual revenue growth slowed sharply, turned slightly negative for a period, and then returned to low single-digit growth in the latest readings. That pattern suggests the company is still operating in a softer demand environment than the sector median, especially on the biotech side and in discretionary project starts.
Cash generation remains an important positive. Free cash flow has stayed substantial even with fluctuations, and the latest trailing level remains strong in absolute terms. That matters because CRO businesses can sometimes look weak on earnings during periods of margin pressure while still producing meaningful cash from operations. If demand normalizes and operating efficiency improves, that cash profile could provide flexibility for debt reduction, technology investment, and selective acquisitions.
A practical catalyst for future growth is any recovery in biotech funding and trial starts. Another is a better mix of large pharma work, which tends to be more resilient. Company updates and investor materials have also emphasized backlog and demand visibility as important indicators; for a CRO, stable or improving backlog can translate into future revenue with a lag. In addition, the broader industry focus on speeding up trial recruitment and reducing development timelines creates opportunities for larger providers that can offer integrated services at scale.
Risks
This article is for informational purposes only and does not constitute financial advice. Some content is AI-generated. See Disclaimer


