Stock Analysis · ICF International Inc (ICFI)
Overview
ICF International is a consulting and technology services company that works mainly with government agencies and large commercial clients. Its business sits at the intersection of policy, operations, digital modernization, data, energy transition, public health, disaster recovery, and marketing services. In simple terms, ICF helps organizations design programs, manage them, measure results, and increasingly deliver those services through software, digital platforms, and specialized domain expertise.
The company’s client base is led by the U.S. federal government, with additional work for state and local governments and a smaller commercial segment. This matters because ICF is not a typical cyclical industrial company driven by factories or commodities. Its revenue depends more on public spending priorities, long-duration contracts, regulatory change, and specialized professional services demand.
Based on recent company disclosures, revenue is concentrated in a few broad buckets that can be summarized as follows:
- U.S. federal government: about 55% to 65% of revenue. This includes civilian agencies working on energy, environment, health, social programs, infrastructure, disaster response, and digital modernization.
- Commercial energy, utilities, and other commercial clients: about 20% to 30%. This work includes energy efficiency programs, electrification, customer engagement, climate and sustainability advisory, and marketing or digital services.
- State and local government and international public sector: about 10% to 20%. This includes implementation support, grants administration, public health, resilience, and community development programs.
That revenue mix gives ICF a somewhat defensive profile compared with many consulting firms because a large share is tied to regulated sectors and public-sector missions. At the same time, it also creates concentration risk because government budgets and procurement timing can strongly affect results.
The multi-year financial pattern shows a business that expanded meaningfully from 2021 through 2024, followed by a pullback in 2025. Revenue climbed from roughly $1.6 billion in 2021 to just over $2.0 billion in 2024 before slipping to about $1.9 billion in 2025. Profit also improved into 2024 and then softened. Even with that volatility, free cash flow remains a notable strength relative to the company’s size.
The operating profile improved steadily through 2024, with revenue and operating income both moving higher, before 2025 showed a clear reset. The important point is that the business still converts a meaningful share of earnings into cash, which gives management flexibility while growth normalizes.
Key Figures
| Metric | Value | Sector ⓘ |
|---|---|---|
| Date | Oct 17, 2026 | |
| Context | ||
| Sector | Industrials | |
| Industry | Consulting Services | |
| Market Cap ⓘ | $1.57B | |
| Beta ⓘ | 0.53 | |
Value (Cheapness) | ||
| P/E Ratio ⓘ | 18.18 | 22.10 |
| P/B Ratio ⓘ | 1.49 | 1.97 |
| FCF Yield ⓘ | 12.66% | 6.38% |
| Dividend Yield ⓘ | 0.64% | 1.94% |
| EBIT / EV ⓘ | 6.50% | 4.79% |
| PEG ⓘ | 1.88 | |
Growth (Business expansion) | ||
| Revenue Growth ⓘ | -0.30% | 9.30% |
| RPS Growth (5Y CAGR) ⓘ | 5.78% | 7.81% |
| EPS Growth (5Y CAGR) ⓘ | -13.59% | -13.06% |
| BVPS Growth (5Y CAGR) ⓘ | 7.37% | 6.14% |
| Margin Growth (5Y Trend) ⓘ | -0.66% | 0.88% |
| FCF Growth (5Y CAGR) ⓘ | 7.42% | 11.01% |
| DPS Growth (5Y CAGR) ⓘ | 0.44% | 9.48% |
Quality (Business durability) | ||
| ROIC (Latest) ⓘ | 7.24% | 10.84% |
| ROA (Latest) ⓘ | 4.20% | 5.41% |
| ROIC (5Y Median) ⓘ | 6.97% | 9.38% |
| ROA (5Y Median) ⓘ | 4.05% | 4.95% |
| Net Debt / EBIT (Latest) ⓘ | 4.18 | 2.08 |
| Net Debt / EBIT (5Y Median) ⓘ | 4.70 | 2.27 |
| Net Debt / EBITDA (Latest) ⓘ | 2.96 | 1.39 |
| Net Debt / Assets ⓘ | 26.70% | 19.28% |
| EBITDA / Interest ⓘ | 6.63 | 9.58 |
| Operating Margin (Latest) ⓘ | 7.36% | 10.50% |
| Operating Margin (5Y Median) ⓘ | 6.94% | 10.29% |
| Debt to Equity (Latest) ⓘ | 53.79% | 65.48% |
| Profit Margin (Latest) ⓘ | 4.86% | 6.67% |
| Free Cash Flow (Latest) ⓘ | $198.55M | |
Momentum (Price trend) | ||
| 3Y Return ⓘ | -33.22% | +61.68% |
| 12M Return (excl. last month) ⓘ | -10.44% | +12.58% |
| 6M Return ⓘ | +23.85% | 0.00% |
| Price vs. 200-Day MA ⓘ | +10.50% | +0.02% |
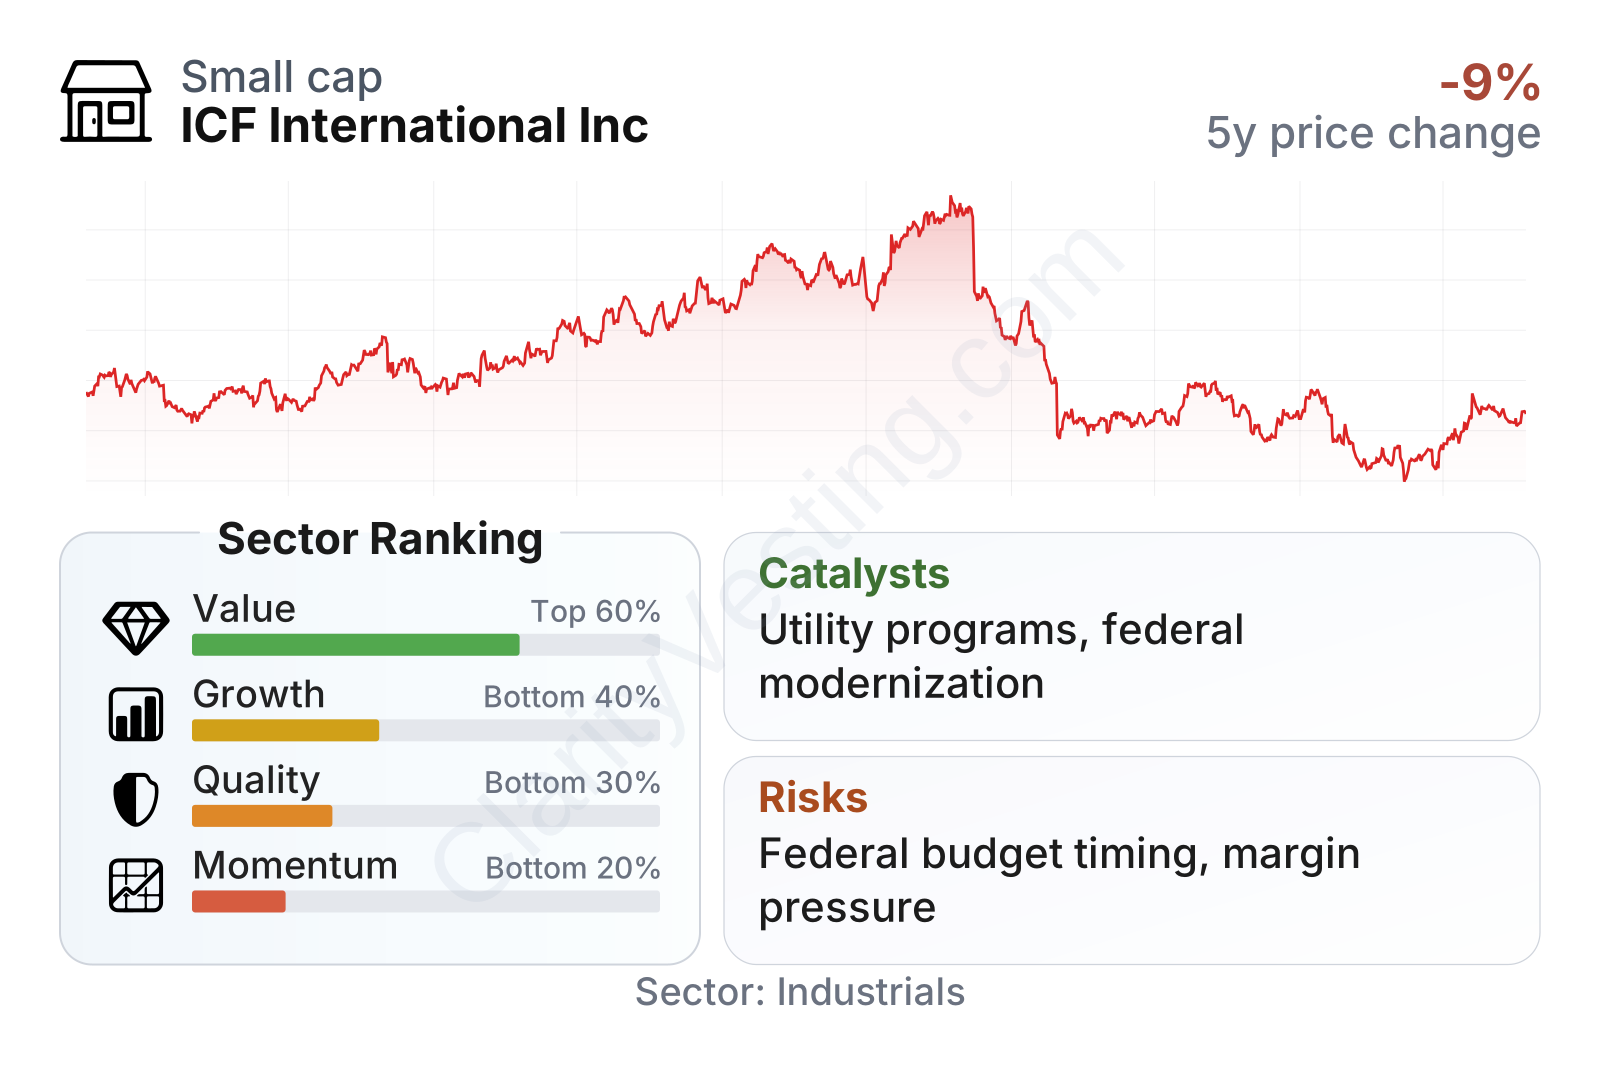
ICF is a mid-sized company with relatively low share-price volatility, as reflected in a beta well below 1. On valuation, it screens cheaper than the sector on earnings and book value, while its free-cash-flow yield stands out as stronger than many peers. The weaker area is growth and broader quality rankings: revenue growth has slowed, margins remain below the sector median, and leverage is still noticeable even though balance-sheet pressure has eased versus earlier periods.
The stock history also helps explain current sentiment. After a strong run into 2024, the shares fell sharply in 2025 and remained well below prior highs in 2026. More recently, momentum has improved over the last six months, suggesting the market may be reassessing the business after a period of disappointment.
Growth
ICF operates in several markets that should remain structurally relevant over a long period: energy efficiency and grid modernization, electrification, environmental and climate-related advisory, disaster recovery, public health program support, and government digital transformation. These are not narrow one-year themes. They are tied to regulation, aging infrastructure, resilience planning, and the need for agencies and utilities to modernize operations while controlling costs.
The company’s strategy also makes practical sense. Rather than competing purely as a generalist consultant, ICF focuses on domain-heavy work where policy knowledge, implementation capability, and client relationships matter. That positioning is especially useful in federal contracting and regulated utility work, where winning and delivering contracts often depends on specialized expertise more than branding alone.
Recent growth has clearly slowed. Strong double-digit expansion in 2022 and parts of 2023 faded to low single digits in 2024, then turned negative through much of 2025 and remained near flat to slightly negative in the latest period. For a long-term view, that creates a split picture: the end markets still look attractive, but execution and project timing have recently been weaker than the sector overall.
Cash generation is the more encouraging part of the growth picture. Free cash flow has trended upward over the last several years and remains solid, reaching roughly $200 million on a trailing basis. That matters because consulting and services companies can look healthy on revenue while producing limited cash. ICF currently shows the opposite pattern: growth has cooled, but cash conversion remains one of the more supportive features in the business.
A meaningful catalyst is the company’s alignment with utility and public-sector spending priorities. Utilities continue to invest in energy efficiency, load management, customer programs, and grid-related services. Governments continue to fund areas such as disaster recovery, infrastructure implementation, health administration, and technology modernization. If procurement activity improves and delayed projects restart, ICF has several channels for growth without needing a dramatic change in its business model.
Another recent opportunity comes from the company’s ongoing push into higher-value digital and technology-enabled work. Management has increasingly emphasized combining advisory services with platforms, analytics, and implementation tools rather than relying only on traditional billable hours. If that mix shift continues, it could support steadier client retention and potentially better margins over time.
Risks
This article is for informational purposes only and does not constitute financial advice. Some content is AI-generated. See Disclaimer


