Stock Analysis · Interactive Brokers Group Inc (IBKR)
Overview
Interactive Brokers Group Inc. is a global electronic brokerage company. In simple terms, it provides the technology and infrastructure that allow individuals, professional traders, hedge funds, registered investment advisers, and institutions to trade stocks, options, futures, currencies, bonds, and other financial products across many markets. The company is known for a low-cost, highly automated platform and for serving active and sophisticated users who want broad market access.
Its business model is different from a traditional bank or a full-service brokerage built around branch offices and human advisers. Interactive Brokers relies heavily on software, automation, and direct market connectivity. That helps keep operating costs relatively low and allows the company to scale as client accounts, assets, and trading activity rise.
The company’s revenue mainly comes from a few core activities. Based on recent company disclosures, the largest sources are:
- Net interest income: approximately 60% to 65% of total net revenues in recent periods. This includes interest earned on margin loans to clients, interest on segregated client cash and securities, and interest from investing broker cash balances, offset by interest paid to clients and funding costs.
- Commissions: approximately 20% to 25%. This is the money collected when clients trade equities, options, futures, and other instruments on the platform.
- Other fees and services: approximately 10% to 15%. This includes execution, clearing, market data, order flow-related items, risk management and service fees, and other trading-related income.
- Principal transactions and miscellaneous items: usually a small single-digit percentage, depending on market conditions and accounting classification.
One notable feature of the business is that revenue is not driven only by trading volume. Higher interest rates can also lift profitability because the company earns more on client cash and margin balances. That has made Interactive Brokers a broker with both transaction-driven and rate-sensitive earnings.
Financially, the company has expanded rapidly over the last several years. Total revenue rose from roughly $2.9 billion in 2021 to more than $10.2 billion in 2025, while operating income increased even faster. The overall picture is a business with strong scalability, where revenue growth has not required the same pace of growth in operating expenses.
The long-term trend shows a sharp rise in revenue and operating income, with expenses growing much more slowly. That points to a platform model with strong operating leverage, although a meaningful share of earnings still depends on interest-related activity rather than only trading commissions.
Key Figures
| Metric | Value | Sector ⓘ |
|---|---|---|
| Date | Oct 19, 2026 | |
| Context | ||
| Sector | Financial Services | |
| Industry | Capital Markets | |
| Market Cap ⓘ | $140.89B | |
| Beta ⓘ | 1.37 | |
Value (Cheapness) | ||
| P/E Ratio ⓘ | 31.56 | 12.26 |
| P/B Ratio ⓘ | 1.61 | 1.23 |
| FCF Yield ⓘ | 11.24% | 10.40% |
| Dividend Yield ⓘ | 0.39% | 3.02% |
| EBIT / EV ⓘ | 29.77% | 8.14% |
| PEG ⓘ | 1.48 | |
Growth (Business expansion) | ||
| Revenue Growth ⓘ | 13.50% | 9.25% |
| RPS Growth (5Y CAGR) ⓘ | 31.09% | 12.19% |
| EPS Growth (5Y CAGR) ⓘ | 19.04% | -9.36% |
| BVPS Growth (5Y CAGR) ⓘ | 17.41% | 4.99% |
| Margin Growth (5Y Trend) ⓘ | 72.25% | -3.86% |
| FCF Growth (5Y CAGR) ⓘ | 28.25% | 4.81% |
| DPS Growth (5Y CAGR) ⓘ | 31.52% | 8.79% |
Quality (Business durability) | ||
| ROIC (Latest) ⓘ | 155.37% | 9.49% |
| ROE (Latest) ⓘ | 8.23% | 13.87% |
| ROA (Latest) ⓘ | 0.53% | 1.54% |
| ROIC (5Y Median) ⓘ | 44.56% | 7.86% |
| ROE (5Y Median) ⓘ | 18.66% | 12.17% |
| ROA (5Y Median) ⓘ | 0.49% | 1.30% |
| Net Debt / EBIT (Latest) ⓘ | -0.59 | 0.99 |
| Net Debt / EBIT (5Y Median) ⓘ | 1.60 | 0.73 |
| Net Debt / EBITDA (Latest) ⓘ | -0.58 | 0.91 |
| Operating Margin (Latest) ⓘ | 86.78% | 22.30% |
| Operating Margin (5Y Median) ⓘ | 83.54% | 24.63% |
| Debt to Equity (Latest) ⓘ | 0.08% | 58.04% |
| Profit Margin (Latest) ⓘ | 16.68% | 26.57% |
| Free Cash Flow (Latest) ⓘ | $15.83B | |
Momentum (Price trend) | ||
| 3Y Return ⓘ | +288.66% | +88.26% |
| 12M Return (excl. last month) ⓘ | +39.42% | +19.24% |
| 6M Return ⓘ | +4.37% | +4.70% |
| Price vs. 200-Day MA ⓘ | +0.50% | +3.66% |
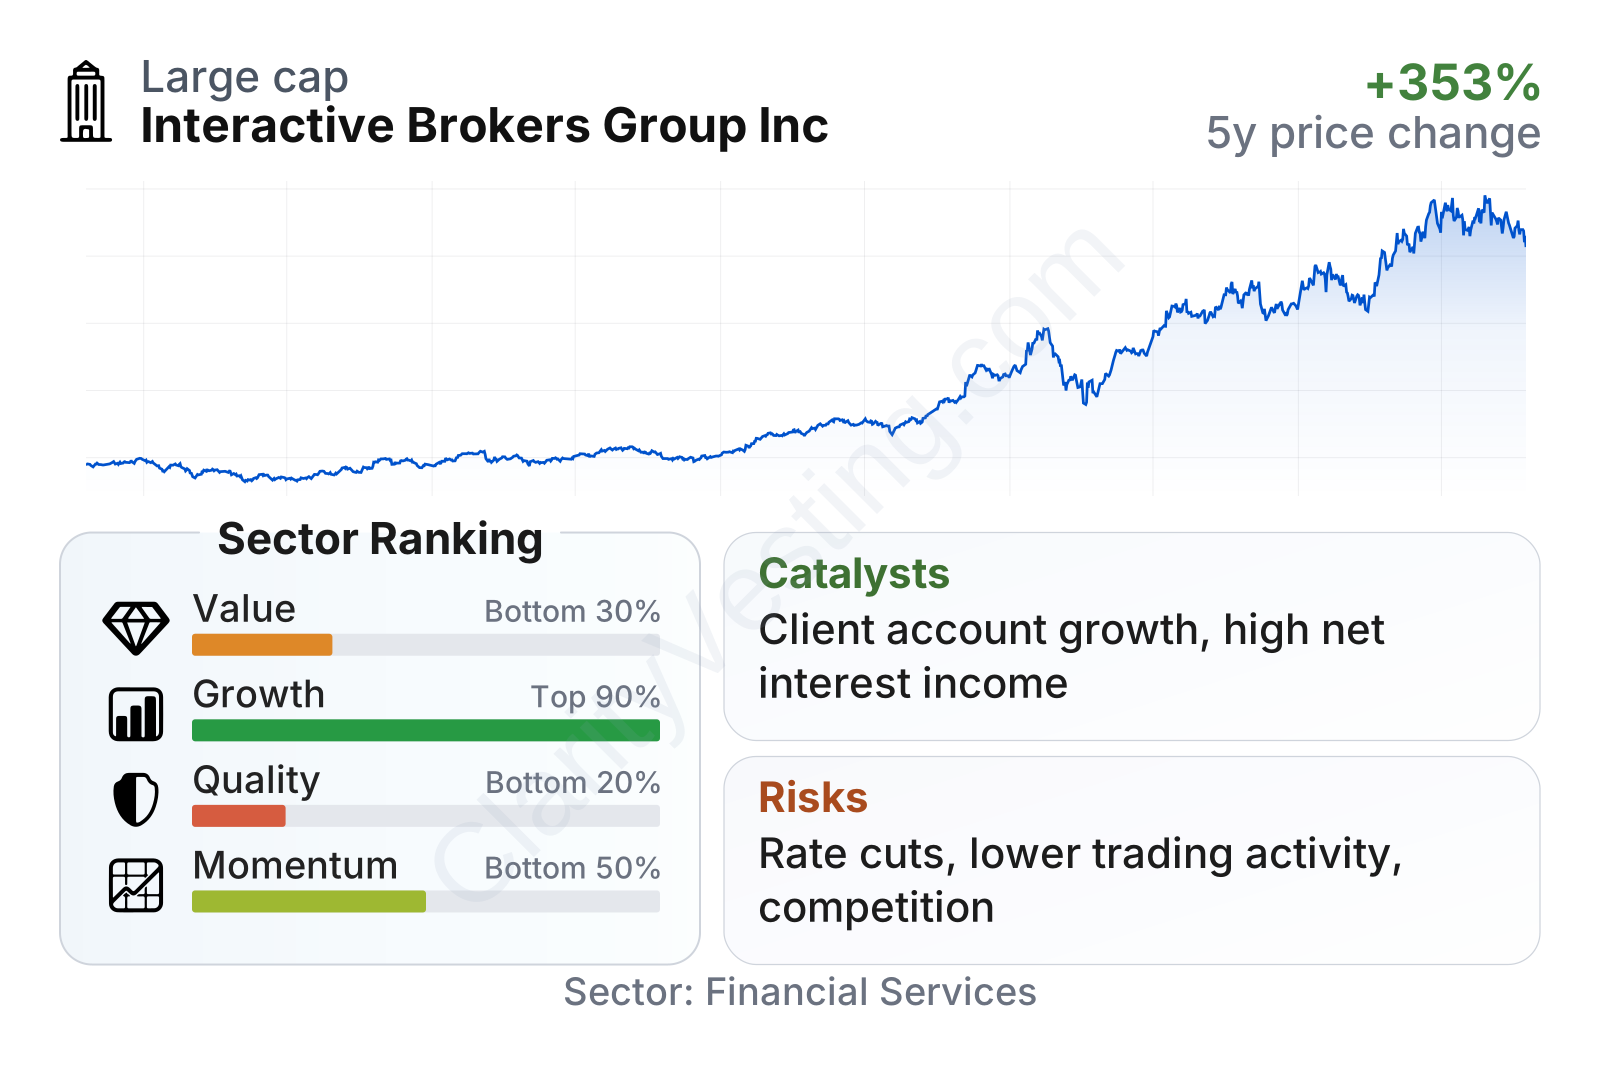
Interactive Brokers is now a very large company in capital markets, and the stock has delivered a very strong multi-year price increase. In the factor summary, growth stands out clearly: revenue, earnings per share, book value per share, margins, and free cash flow have all expanded faster than most of the sector. Value metrics are less favorable, with the shares trading above sector medians on earnings and book value multiples. Quality looks mixed rather than weak in an absolute sense: margins are exceptional and leverage is very low, but return on equity and return on assets sit below many financial peers, partly because brokerage balance sheets are structured differently from many asset-light businesses.
Growth
Interactive Brokers operates in a part of financial services that has favorable long-term tailwinds. Global retail participation in markets has increased, self-directed investing has become more common, and many professional traders want low-cost access to multiple asset classes and international exchanges through a single account. At the same time, advisers and smaller institutions increasingly value technology platforms that can automate execution, custody, reporting, and risk management.
The company’s strategy is aligned with those trends. It competes on price, breadth of products, global reach, and platform functionality rather than on a branch network or expensive advisory model. That approach makes sense in a market where digital-first brokers and infrastructure providers are steadily taking share. The broader the product set and international market access, the harder it is for smaller rivals to match the offering.
There are also clear internal growth drivers. Interactive Brokers has continued adding client accounts, client equity, and daily average revenue trades in recent filings. More accounts can generate several layers of growth at once: higher commission revenue, more client cash balances, more margin lending, and greater cross-selling of products such as options, futures, fixed income, and foreign exchange.
The earnings trend supports that view. Earnings per share have moved up strongly over the last several years, showing that account growth and operating leverage have translated into shareholder economics rather than only top-line expansion.
Book value per share has also risen steadily, which matters for a financial company because it reflects the growth of the capital base supporting the business. Over five years, book value per share compounded much faster than the sector median, suggesting that growth has been accompanied by real balance-sheet accumulation rather than only market enthusiasm.
A major catalyst is the company’s ability to benefit from both market activity and healthy short-term interest rates. If rates remain structurally above the ultra-low levels seen in earlier years, Interactive Brokers can keep earning substantial net interest income on customer-related balances. Another catalyst is international expansion: the company has built a global platform that can attract users in regions where trading sophistication is rising but local brokerage offerings remain narrower or more expensive.
Recent company updates have also highlighted continued record or near-record client metrics, including account additions and customer equity growth. That is important because it suggests momentum is not relying only on a temporary rate cycle. In other words, the customer base itself appears to be deepening.
Risks
This article is for informational purposes only and does not constitute financial advice. Some content is AI-generated. See Disclaimer


