Stock Analysis · i-80 Gold Corp (IAUX)
Overview
i-80 Gold Corp is a Nevada-focused gold producer and developer. The company owns a portfolio of mines, development projects, and processing facilities centered in the Battle Mountain-Eureka and Getchell trends, two well-known gold belts in the United States. In simple terms, it is trying to build a larger regional gold business by producing from a small operating base today while advancing several bigger projects that could lift output over time.
Its revenue currently comes mostly from selling precious metals produced from its mining operations, with a smaller contribution from by-products and processing-related activity. Based on recent company reporting and the way the business is described in filings, the main sources are approximately:
- Gold sales: the dominant source of revenue, likely around 75% to 90% of total revenue in recent periods. This includes ounces produced and sold from the company’s operating assets.
- Silver sales: generally a secondary contributor, roughly around 10% to 20%, depending on mine mix and metal grades.
- Other revenue and by-products: a smaller component, usually below 10%, which can include processing-related items or other mine output depending on the reporting period.
The broader business model is more important than the current revenue mix. i-80 Gold is not yet a mature, high-margin producer. It is in a build-out phase: operating some assets, spending heavily on development, and working toward a larger future production profile. That helps explain why revenue has grown from a very small base over the last few years while profitability has remained deeply negative. Revenue rose from only a few million dollars in 2021 to roughly $90 million in 2025, but costs, interest expense, and development spending have also remained heavy.
The company’s asset base is one of its main attractions. In addition to producing operations, it controls projects such as Granite Creek, McCoy-Cove, Archimedes, and Ruby Hill, plus access to processing infrastructure. For a mining company, that matters because permits, ore bodies, and processing capacity can be difficult and expensive to replicate.
The financial flow over the last several years shows a business that has expanded revenue but has not yet turned that growth into sustainable operating profit. Interest costs and operating expenses remain high, which means the current investment case depends much more on future mine development than on today’s earnings power.
Key Figures
| Metric | Value | Sector ⓘ |
|---|---|---|
| Date | Oct 17, 2026 | |
| Context | ||
| Sector | Basic Materials | |
| Industry | Gold | |
| Market Cap ⓘ | $1.28B | |
| Beta ⓘ | 2.21 | |
Value (Cheapness) | ||
| P/E Ratio ⓘ | N/A | 16.90 |
| P/B Ratio ⓘ | 4.81 | 1.65 |
| FCF Yield ⓘ | -15.23% | 5.76% |
| Dividend Yield ⓘ | N/A | 2.13% |
| EBIT / EV ⓘ | -15.21% | 6.30% |
| PEG ⓘ | N/A | |
Growth (Business expansion) | ||
| Revenue Growth ⓘ | -12.50% | 11.10% |
| RPS Growth (5Y CAGR) ⓘ | 82.49% | 4.49% |
| EPS Growth (5Y CAGR) ⓘ | -18.52% | -13.47% |
| BVPS Growth (5Y CAGR) ⓘ | -25.82% | 5.51% |
| Margin Growth (5Y Trend) ⓘ | N/A | -1.54% |
| FCF Growth (5Y CAGR) ⓘ | N/A | 0.37% |
| DPS Growth (5Y CAGR) ⓘ | N/A | 6.08% |
Quality (Business durability) | ||
| ROIC (Latest) ⓘ | -27.94% | 9.26% |
| ROA (Latest) ⓘ | -30.11% | 4.91% |
| ROIC (5Y Median) ⓘ | -12.49% | 7.70% |
| ROA (5Y Median) ⓘ | -13.83% | 3.86% |
| Net Debt / EBIT (Latest) ⓘ | N/A | 1.40 |
| Net Debt / EBIT (5Y Median) ⓘ | N/A | 1.70 |
| Net Debt / EBITDA (Latest) ⓘ | N/A | 0.95 |
| Net Debt / Assets ⓘ | -1.66% | 13.69% |
| EBITDA / Interest ⓘ | N/A | 12.34 |
| Operating Margin (Latest) ⓘ | -176.34% | 13.20% |
| Operating Margin (5Y Median) ⓘ | -175.76% | 11.80% |
| Debt to Equity (Latest) ⓘ | 172.47% | 40.56% |
| Profit Margin (Latest) ⓘ | -198.82% | 6.43% |
| Free Cash Flow (Latest) ⓘ | -$194.46M | |
Momentum (Price trend) | ||
| 3Y Return ⓘ | -12.73% | +68.89% |
| 12M Return (excl. last month) ⓘ | +80.92% | +30.21% |
| 6M Return ⓘ | -13.25% | -4.16% |
| Price vs. 200-Day MA ⓘ | -10.57% | -1.27% |
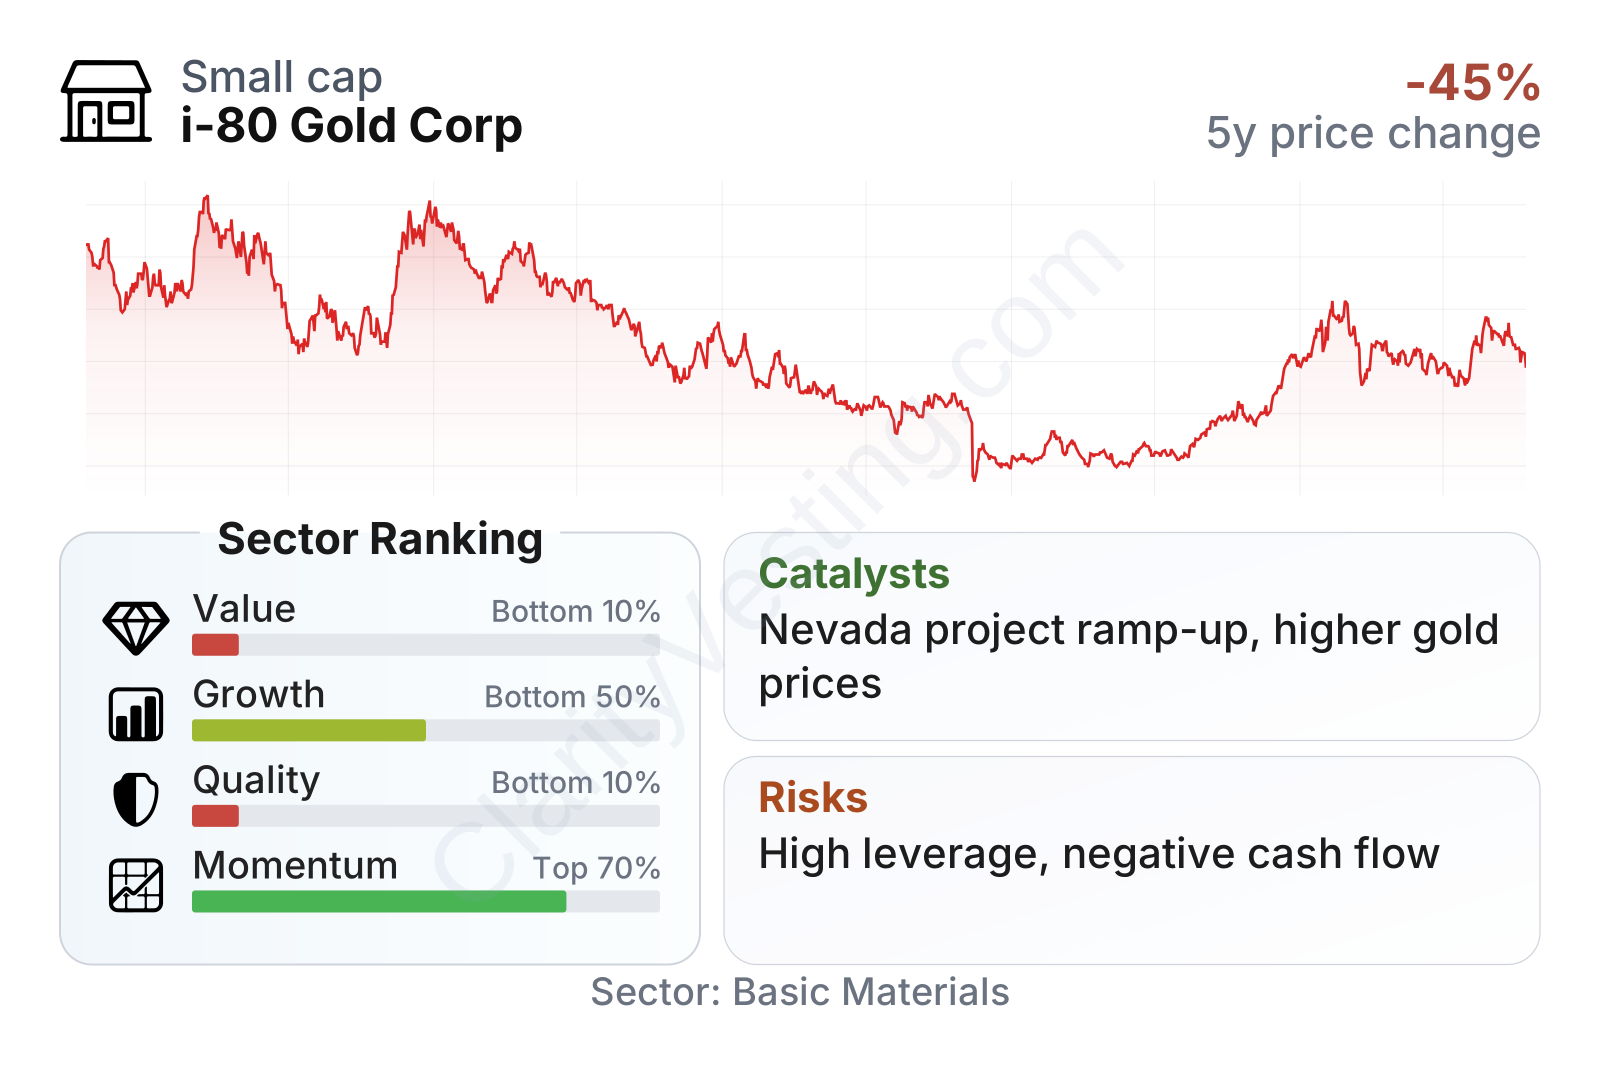
The company sits in the smaller end of the public mining market, and the stock has been volatile, which is common for single-region developers but still notable here given a beta above 2. The factor table points to a difficult current profile: value, quality, and growth rankings are weak versus the broader sector, while price momentum has improved more recently. In practical terms, the market appears to be reacting to future project potential rather than strong present-day profitability or cash generation.
Another point that stands out is the gap between market-based enthusiasm and accounting performance. The price-to-book ratio is well above the sector median, yet free cash flow, return on capital, and margins remain materially below sector norms. That combination usually means the market is assigning value to undeveloped assets and future execution rather than rewarding current operating strength.
Growth
Gold mining remains a relevant long-term sector because gold often benefits from inflation concerns, central bank buying, geopolitical uncertainty, and demand for portfolio hedges. That does not guarantee success for every miner, but it does create a supportive backdrop for companies that can bring new ounces into production at reasonable cost. For i-80 Gold, that is the key question: not whether gold matters, but whether its Nevada asset base can be turned into a larger and more efficient business.
The company’s strategy is logical on paper. Instead of relying on a single mine, it has assembled a district-scale portfolio in one mining-friendly jurisdiction. Nevada is one of the strongest places in the world to operate a gold business because of its geology, existing infrastructure, and long mining history. If i-80 Gold can sequence its projects well, that regional concentration could create operational benefits in mining, trucking, processing, staffing, and capital allocation.
Revenue growth has been uneven, with sharp jumps in some quarters followed by pullbacks in others. That pattern is typical of a company still ramping operations and dealing with mine sequencing, grades, and development timing. The longer trend still shows that the business has grown far beyond its 2021 level, but the path has been unstable rather than smooth.
Free cash flow remains clearly negative, which shows growth is still being funded rather than harvested. That is not unusual for a mine developer, but it raises the bar for execution. Future upside depends on converting capital spending into higher production, lower unit costs, and eventually positive cash generation.
The strongest catalysts are tied to project development. Public company materials in 2026 continue to emphasize progress at key Nevada assets, including underground development, metallurgical work, and plans that could support a larger production profile over time. In a company like this, meaningful catalysts are usually operational rather than financial engineering: feasibility work, permitting progress, construction milestones, and evidence that ore can be mined and processed as expected.
There is also a macro catalyst. A higher gold price can have a strong effect on smaller producers and developers because it improves project economics, financing flexibility, and the perceived value of in-ground resources. That does not eliminate execution risk, but it can materially change how the market values a company that owns several advanced gold projects.
Risks
This article is for informational purposes only and does not constitute financial advice. Some content is AI-generated. See Disclaimer


