Stock Analysis · Insurance Australia Group Ltd (IAUGY)
Overview
Insurance Australia Group Ltd is a property and casualty insurer focused mainly on Australia and New Zealand. It sells personal insurance such as motor and home cover, and commercial insurance for small and mid-sized businesses. The group operates through a portfolio of well-known brands including NRMA Insurance, CGU, WFI and AMI, and it also has partnerships that distribute insurance through banks, retailers and other institutions. In simple terms, the company collects premiums, invests part of those funds, pays claims when covered events happen, and aims to earn an underwriting profit over time.
The business is mainly driven by general insurance premiums, with investment income and fees adding a smaller contribution. Based on recent annual reporting, revenue sources can be described approximately as follows:
- Insurance revenue in Australia: about 75% to 80% of group revenue. This includes personal lines such as motor and home insurance, plus commercial lines sold under several brands.
- Insurance revenue in New Zealand: about 10% to 15%. This mainly includes personal and commercial general insurance sold through local brands and distribution partners.
- Net investment income and other operating income: about 10% to 15%. This incorporates returns from the insurer’s investment portfolio and smaller non-premium income streams.
The overall business mix is attractive for readers looking for a simple long-term framework: most earnings are tied to everyday insurance products that remain necessary regardless of the economic cycle, while pricing and investment returns can meaningfully influence profits from year to year.
The revenue and profit flow shows a company that expanded strongly through 2025, with rising revenue and operating income, although the latest year appears less smooth and highlights how insurance results can move sharply when claims, reserving, or accounting presentation shifts.
Key Figures
| Metric | Value | Sector ⓘ |
|---|---|---|
| Date | Oct 17, 2026 | |
| Context | ||
| Sector | Financial Services | |
| Industry | Insurance - Property & Casualty | |
| Market Cap ⓘ | $13.74B | |
| Beta ⓘ | -0.05 | |
Value (Cheapness) | ||
| P/E Ratio ⓘ | 18.99 | 12.26 |
| P/B Ratio ⓘ | 2.23 | 1.23 |
| FCF Yield ⓘ | 16.50% | 10.40% |
| Dividend Yield ⓘ | 3.82% | 3.02% |
| EBIT / EV ⓘ | N/A | 8.14% |
| PEG ⓘ | N/A | |
Growth (Business expansion) | ||
| Revenue Growth ⓘ | 10.30% | 9.35% |
| RPS Growth (5Y CAGR) ⓘ | 21.86% | 12.19% |
| EPS Growth (5Y CAGR) ⓘ | N/A | -9.53% |
| BVPS Growth (5Y CAGR) ⓘ | 2.66% | 4.99% |
| Margin Growth (5Y Trend) ⓘ | 3.61% | -3.86% |
| FCF Growth (5Y CAGR) ⓘ | 3.76% | 4.81% |
| DPS Growth (5Y CAGR) ⓘ | 9.32% | 8.79% |
Quality (Business durability) | ||
| ROIC (Latest) ⓘ | N/A | 9.49% |
| ROE (Latest) ⓘ | 34.90% | 13.90% |
| ROA (Latest) ⓘ | 9.02% | 1.55% |
| ROIC (5Y Median) ⓘ | 12.62% | 7.86% |
| ROE (5Y Median) ⓘ | 14.42% | 12.17% |
| ROA (5Y Median) ⓘ | 2.96% | 1.30% |
| Net Debt / EBIT (Latest) ⓘ | N/A | 0.96 |
| Net Debt / EBIT (5Y Median) ⓘ | 0.90 | 0.73 |
| Net Debt / EBITDA (Latest) ⓘ | 0.29 | 0.92 |
| Operating Margin (Latest) ⓘ | N/A | 22.30% |
| Operating Margin (5Y Median) ⓘ | 12.23% | 24.63% |
| Debt to Equity (Latest) ⓘ | 44.84% | 58.56% |
| Profit Margin (Latest) ⓘ | 5.34% | 26.57% |
| Free Cash Flow (Latest) ⓘ | $2.27B | |
Momentum (Price trend) | ||
| 3Y Return ⓘ | +81.44% | +88.33% |
| 12M Return (excl. last month) ⓘ | -4.20% | +19.38% |
| 6M Return ⓘ | +11.89% | +4.75% |
| Price vs. 200-Day MA ⓘ | +12.08% | +3.50% |
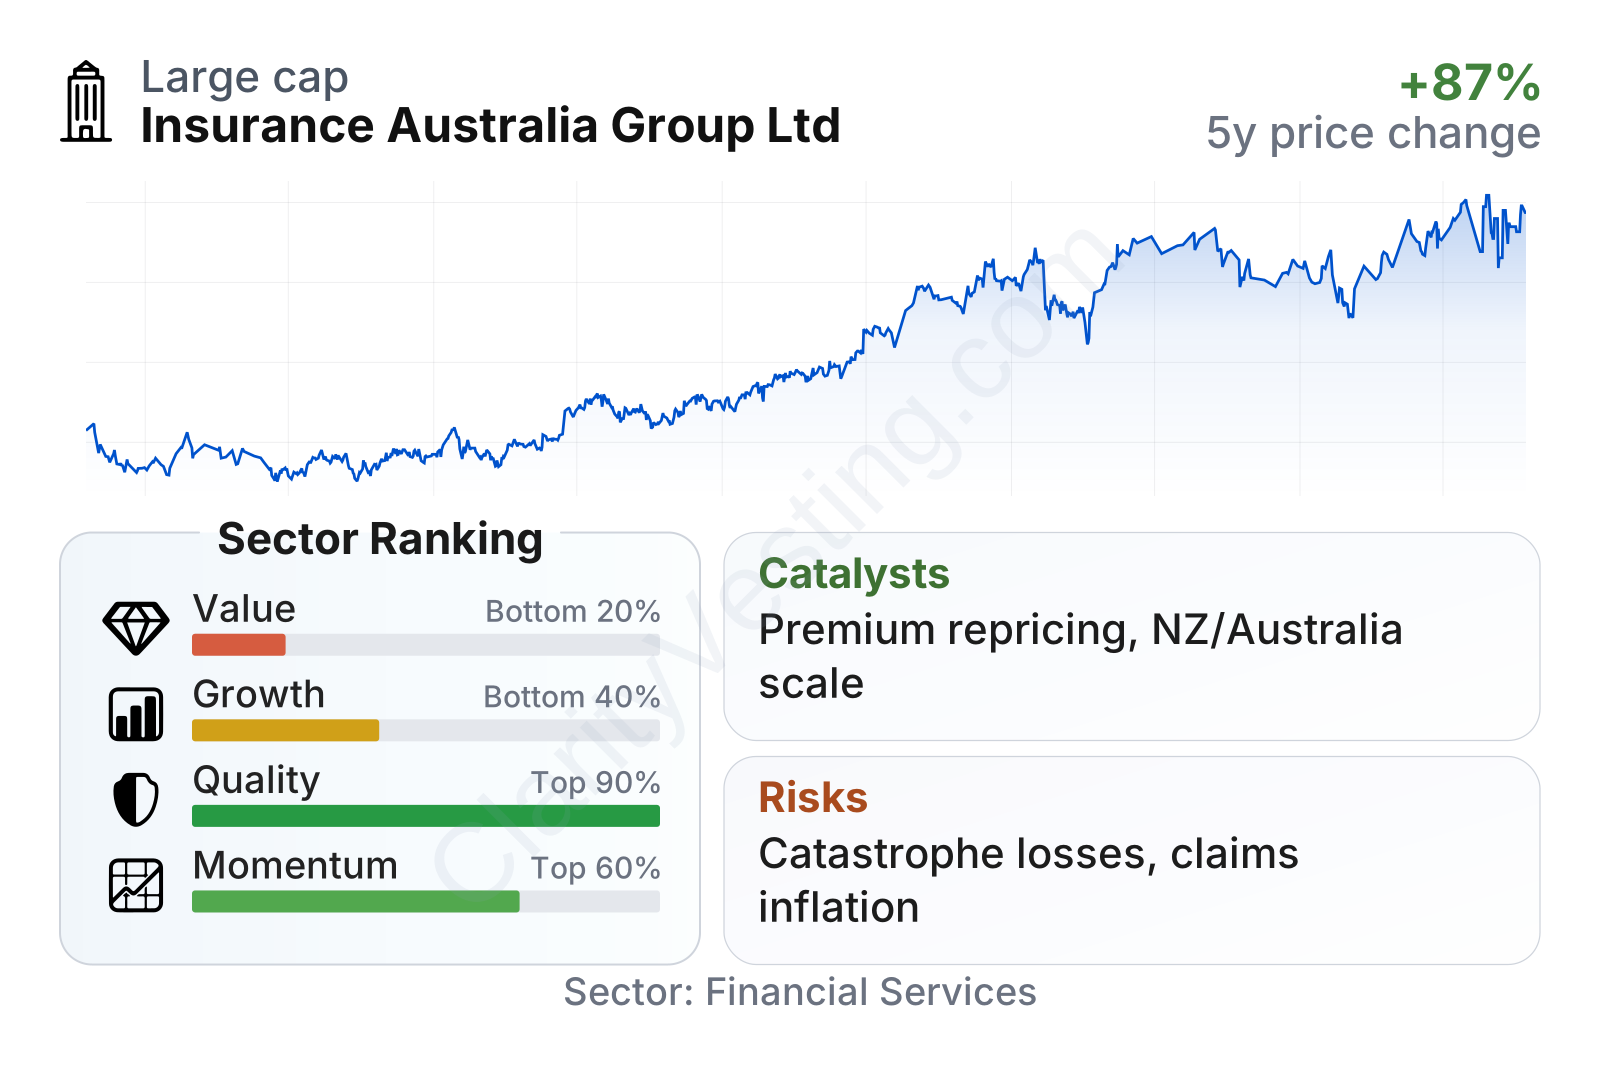
Insurance Australia Group is a large insurer by regional standards, with a market value around the low-teens billions of dollars. The share price trend has been strong over the last several years, especially from 2023 into 2024 and again into 2026, although the shorter-term performance has been less dramatic than the sector median. The metrics table paints a mixed but understandable picture: quality is clearly strong versus peers, growth is respectable rather than exceptional, momentum is middling, and valuation sits on the expensive side of the sector.
Two details stand out. First, profitability and capital efficiency metrics rank very well against peers, which is notable in insurance because disciplined underwriting matters more than raw premium growth. Second, the stock trades at higher earnings and book multiples than the sector median, suggesting the market already recognizes much of that quality.
Growth
The company operates in a sector that has a durable long-term demand base. Motor, home, and commercial property insurance are recurring necessities, and rising insured values, population growth, and premium repricing can all support revenue expansion over time. In Australia and New Zealand, insurers also benefit from relatively high insurance penetration and established consumer habits, which makes the market mature but still capable of steady nominal growth.
IAG’s strategy for future expansion appears sensible because it relies less on aggressive geographic expansion and more on underwriting discipline, pricing, brand strength, and distribution partnerships. That approach can be slower than chasing new markets, but it is usually more consistent for a regional insurer. The company has also emphasized simplification, digital claims handling, and portfolio optimization, which can improve expense efficiency and customer retention if executed well.
A major growth catalyst is premium repricing after years of elevated claims inflation and catastrophe pressure. When insurers can raise rates faster than claims costs normalize, margins can recover quickly. That dynamic helps explain why earnings improved materially after weaker periods. Another support factor is investment income: insurers hold large investment portfolios, so higher base rates can lift returns, even if this advantage moderates if interest rates fall later.
The earnings trend shows a meaningful rebound from a much weaker base, which is often what investors look for in insurers after difficult claims periods. That said, insurance earnings rarely move in a straight line, so the key question is whether the recent improvement reflects sustainable underwriting quality rather than only favorable short-term conditions.
Book value per share has risen overall across the last several years, though not in a perfectly smooth way. That matters because book value is an important anchor for insurers: it reflects the capital base supporting underwriting and absorbing catastrophe volatility. Moderate long-term growth here suggests the business has been building value, but not at a pace that fully removes the need for continued underwriting discipline.
Recent company updates have also pointed to a solid operating environment in core markets, with ongoing pricing strength and portfolio actions supporting margins. For a regional insurer, this combination of pricing power, brand reach, and operational streamlining is probably the clearest visible opportunity over the next few years.
Risks
This article is for informational purposes only and does not constitute financial advice. Some content is AI-generated. See Disclaimer


