Stock Analysis · Hancock Whitney Corp (HWC)
Overview
Hancock Whitney Corp is a regional bank headquartered in the Gulf South. Through Hancock Whitney Bank, it provides traditional banking services such as loans, deposit accounts, treasury management, and wealth-related services to businesses and individuals. Its footprint is concentrated in Louisiana, Mississippi, Alabama, Florida, and Texas, which gives it meaningful exposure to fast-growing parts of the Southeast and Gulf Coast economies.
Like most regional banks, its revenue does not come from selling physical products. It is mainly generated by earning interest on loans and securities, along with fees from customer services. Based on recent annual reporting, the business mix is broadly organized as follows:
- Net interest income: approximately 70% to 80% of total revenue. This is the spread between what the bank earns on loans and investment securities and what it pays on deposits and other funding sources.
- Noninterest income: approximately 20% to 30% of total revenue. This includes service charges, card and ATM fees, trust and asset management fees, treasury services, mortgage banking, investment brokerage, and insurance-related commissions.
- Within lending activity, the largest exposure is typically commercial banking, including commercial real estate, commercial and industrial loans, and specialized business lending, with consumer and residential lending representing a smaller share.
Over the last several years, total revenue has generally moved higher even though earnings were more uneven, reflecting the banking sector’s changing interest-rate environment. Operating costs have stayed fairly controlled, while swings in funding costs and credit conditions have had a bigger effect on profit than on revenue.
The revenue base has expanded since 2021, and expenses have been relatively stable compared with that growth. The main pressure point has been interest expense, which rose sharply when rates increased, a common pattern across regional banks. That helps explain why revenue recovered faster than profitability.
Key Figures
| Metric | Value | Sector ⓘ |
|---|---|---|
| Date | Oct 24, 2026 | |
| Context | ||
| Sector | Financial Services | |
| Industry | Banks - Regional | |
| Market Cap ⓘ | $5.80B | |
| Beta ⓘ | 0.99 | |
Value (Cheapness) | ||
| P/E Ratio ⓘ | 14.15 | 12.46 |
| P/B Ratio ⓘ | 1.40 | 1.25 |
| FCF Yield ⓘ | 9.65% | 9.82% |
| Dividend Yield ⓘ | 0.61% | 2.94% |
| EBIT / EV ⓘ | 8.36% | 8.11% |
| PEG ⓘ | 1.76 | |
Growth (Business expansion) | ||
| Revenue Growth ⓘ | 8.60% | 9.10% |
| RPS Growth (5Y CAGR) ⓘ | 12.06% | 12.31% |
| EPS Growth (5Y CAGR) ⓘ | -6.06% | -6.97% |
| BVPS Growth (5Y CAGR) ⓘ | 6.30% | 5.02% |
| Margin Growth (5Y Trend) ⓘ | -11.23% | -4.00% |
| FCF Growth (5Y CAGR) ⓘ | -1.79% | 4.71% |
| DPS Growth (5Y CAGR) ⓘ | 13.93% | 8.92% |
Quality (Business durability) | ||
| ROIC (Latest) ⓘ | 7.34% | 9.18% |
| ROE (Latest) ⓘ | 9.43% | 13.93% |
| ROA (Latest) ⓘ | 1.11% | 1.57% |
| ROIC (5Y Median) ⓘ | 9.06% | 7.80% |
| ROE (5Y Median) ⓘ | 11.62% | 12.15% |
| ROA (5Y Median) ⓘ | 1.32% | 1.28% |
| Net Debt / EBIT (Latest) ⓘ | 1.45 | 1.02 |
| Net Debt / EBIT (5Y Median) ⓘ | 0.67 | 0.72 |
| Net Debt / EBITDA (Latest) ⓘ | 1.58 | 0.88 |
| Operating Margin (Latest) ⓘ | 28.20% | 22.30% |
| Operating Margin (5Y Median) ⓘ | 31.00% | 24.50% |
| Debt to Equity (Latest) ⓘ | 35.81% | 59.34% |
| Profit Margin (Latest) ⓘ | 28.41% | 26.42% |
| Free Cash Flow (Latest) ⓘ | $559.70M | |
Momentum (Price trend) | ||
| 3Y Return ⓘ | +138.53% | +95.73% |
| 12M Return (excl. last month) ⓘ | +21.07% | +17.30% |
| 6M Return ⓘ | +10.64% | +6.07% |
| Price vs. 200-Day MA ⓘ | +5.01% | +5.36% |
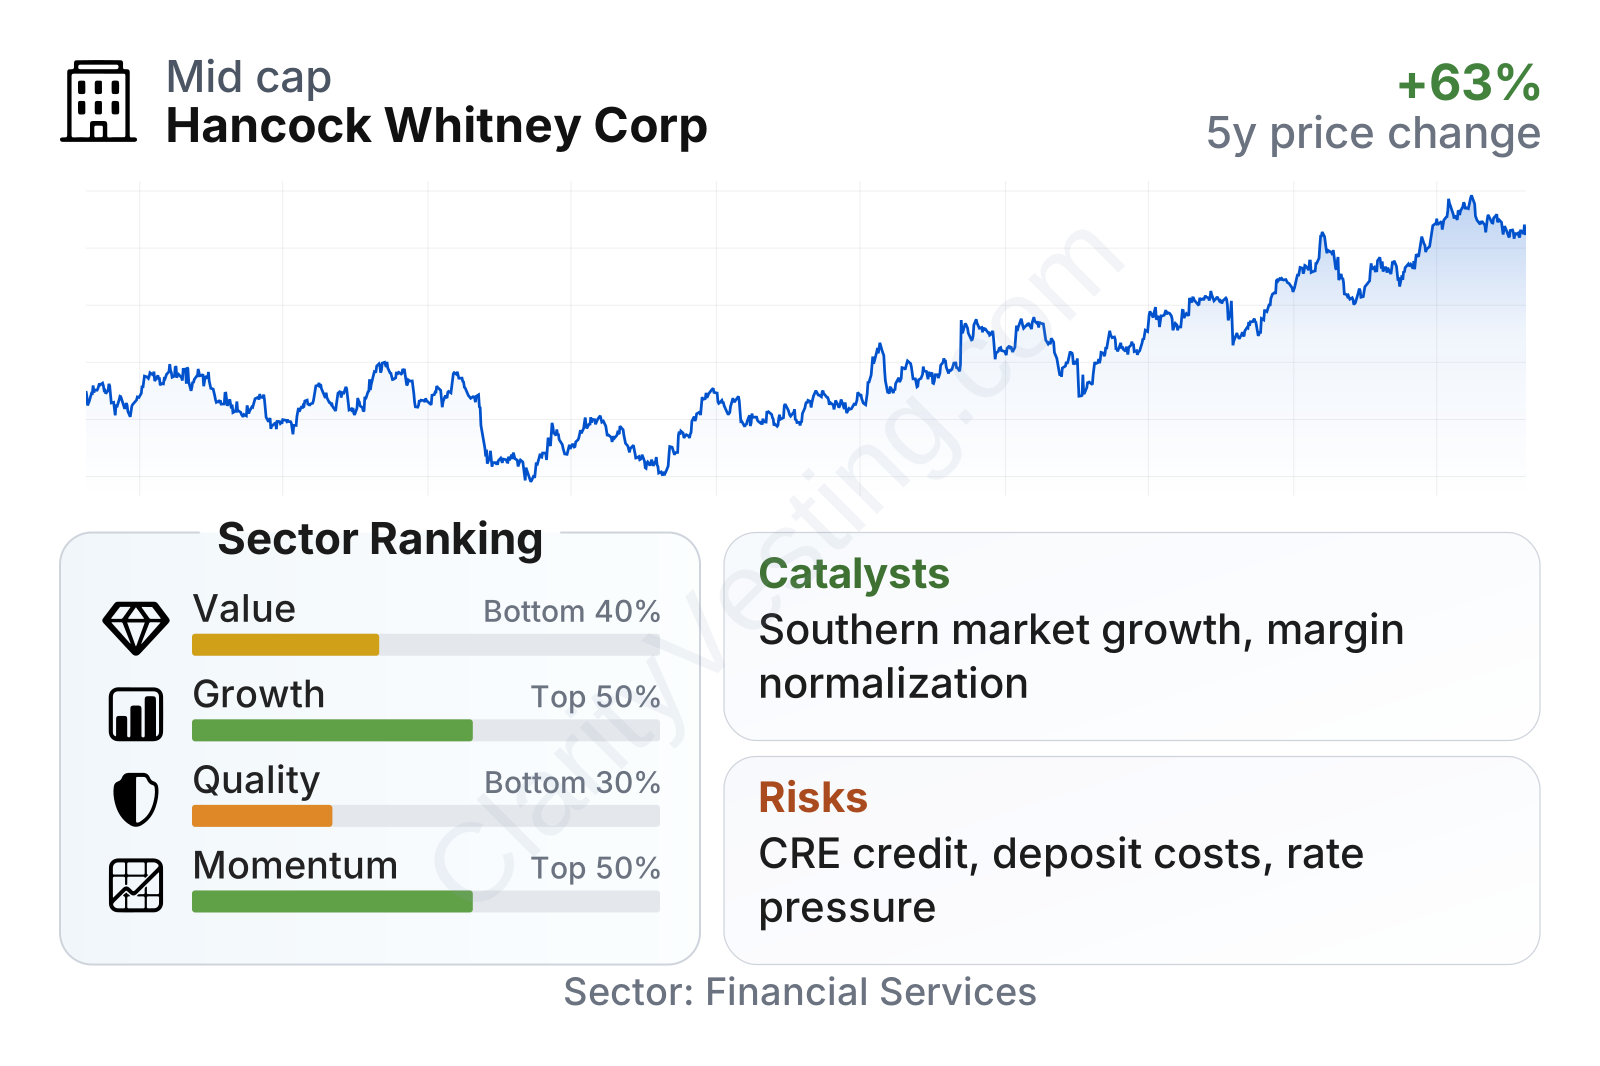
Hancock Whitney is a mid-sized regional bank with a market value around $6 billion and a share-price volatility close to the broader market. The overall profile is mixed: valuation looks neither deeply discounted nor stretched against regional bank peers, while growth and quality rankings sit below the sector median. Profitability margins remain solid, but returns on equity and assets have softened versus stronger banks in the group. Share-price performance has been better than the sector median over the last several measured periods, suggesting the market has recently given the company some credit for stability and balance-sheet improvement.
Growth
Regional banking is not a high-growth industry in the way software or semiconductors can be, but it remains closely tied to population growth, business formation, real estate activity, and local economic expansion. That matters for Hancock Whitney because its core markets in the Southeast and Gulf Coast have generally benefited from migration, infrastructure spending, energy activity, port logistics, healthcare expansion, and small-to-mid-sized business growth. In that sense, the company operates in a sector with moderate structural growth, but in attractive local markets.
The company’s strategy is fairly straightforward and sensible for a long-term banking franchise: gather stable deposits, lend carefully in markets it knows well, deepen commercial relationships, and add fee income through treasury management, wealth, and other banking services. For a regional bank, this relationship-driven approach can be more durable than chasing rapid balance-sheet expansion. It also helps diversify income away from pure loan spreads.
Earnings per share have shown recovery after the 2023 dip, though not a straight-line advance. That pattern suggests the franchise remained profitable through a difficult rate cycle, but also shows that earnings are still sensitive to funding costs and credit normalization. The more encouraging point is that profitability rebounded rather than continuing to erode.
Book value per share has trended upward over the last few years, which is an important signal for a bank. It indicates that the company has continued to build capital over time even while the sector went through deposit stress and bond-market volatility. That does not guarantee future growth, but it supports the view that the balance sheet has been strengthening.
Potential catalysts are mostly operational rather than transformational. If deposit costs stabilize, loan yields remain healthy, and credit quality stays under control, earnings power could continue improving. Another useful tailwind is the company’s footprint in faster-growing Southern markets, where commercial activity and household formation can support both lending and fee generation. Recent company communications in 2026 have also highlighted continued capital return, disciplined expense management, and ongoing digital and service investments, all of which point to a management team focused more on steady compounding than headline expansion.
Risks
This article is for informational purposes only and does not constitute financial advice. Some content is AI-generated. See Disclaimer


