Stock Analysis · Hutchison Port Holdings Trust (HUPHY)
Overview
Hutchison Port Holdings Trust is a port operator focused on container terminals. The trust owns, develops, and operates deep-water container ports, with its core assets located in Hong Kong and Shenzhen in southern China. In practical terms, the business makes money by handling shipping containers, providing terminal services to shipping lines, and managing the flow of cargo through major trade gateways in the Pearl River Delta.
The company’s revenue base is concentrated in port operations rather than spread across many unrelated activities. Based on public company reporting, the largest economic drivers are the Hong Kong terminals, followed by Yantian in Shenzhen and then other river trade and related port service activities. Exact line-by-line percentages can vary by year, but the business mix is broadly centered on:
- Container terminal handling and related services in Hong Kong — approximately 40% to 50% of revenue in recent years, including loading and unloading, berth services, yard handling, and storage.
- Yantian terminal operations in Shenzhen — approximately 35% to 45% of revenue, tied to international gateway cargo and export-oriented trade flows.
- River trade terminals and other port-related services — approximately 10% to 20% of revenue, including feeder, barge, and supporting logistics-related activities.
This is a relatively focused infrastructure business. Demand depends mainly on trade volumes, shipping activity, port throughput, and terminal pricing rather than on consumer brands or rapid product cycles. That makes the business easier to understand, but it also ties results closely to economic activity in China and regional shipping conditions.
The multiyear financial flow shows a business that remained highly profitable at the operating level even as revenue fell from 2021 to 2023, then recovered in 2024 and 2025. Gross profit and operating income improved again after the 2023 low point, while interest expense stayed meaningful, which helps explain why net income has been much more volatile than operating profit.
Key Figures
| Metric | Value | Sector ⓘ |
|---|---|---|
| Date | Oct 17, 2026 | |
| Context | ||
| Sector | Industrials | |
| Industry | Marine Shipping | |
| Market Cap ⓘ | $1.76B | |
| Beta ⓘ | 0.36 | |
Value (Cheapness) | ||
| P/E Ratio ⓘ | 13.97 | 22.10 |
| P/B Ratio ⓘ | 0.01 | 1.97 |
| FCF Yield ⓘ | 488.45% | 6.38% |
| Dividend Yield ⓘ | 7.19% | 1.94% |
| EBIT / EV ⓘ | N/A | 4.79% |
| PEG ⓘ | N/A | |
Growth (Business expansion) | ||
| Revenue Growth ⓘ | 9.50% | 9.30% |
| RPS Growth (5Y CAGR) ⓘ | 104.87% | 7.81% |
| EPS Growth (5Y CAGR) ⓘ | -14.82% | -13.06% |
| BVPS Growth (5Y CAGR) ⓘ | 57.93% | 6.14% |
| Margin Growth (5Y Trend) ⓘ | -1.31% | 0.88% |
| FCF Growth (5Y CAGR) ⓘ | -8.89% | 11.01% |
| DPS Growth (5Y CAGR) ⓘ | 103.60% | 9.48% |
Quality (Business durability) | ||
| ROIC (Latest) ⓘ | N/A | 10.84% |
| ROA (Latest) ⓘ | 1.71% | 5.41% |
| ROIC (5Y Median) ⓘ | 5.92% | 9.38% |
| ROA (5Y Median) ⓘ | 0.92% | 4.95% |
| Net Debt / EBIT (Latest) ⓘ | 1.87 | 2.08 |
| Net Debt / EBIT (5Y Median) ⓘ | 3.41 | 2.27 |
| Net Debt / EBITDA (Latest) ⓘ | 1.18 | 1.39 |
| Net Debt / Assets ⓘ | 19.29% | 19.28% |
| EBITDA / Interest ⓘ | 9.56 | 9.58 |
| Operating Margin (Latest) ⓘ | 40.36% | 10.50% |
| Operating Margin (5Y Median) ⓘ | 37.52% | 10.29% |
| Debt to Equity (Latest) ⓘ | 96.27% | 65.48% |
| Profit Margin (Latest) ⓘ | 7.85% | 6.67% |
| Free Cash Flow (Latest) ⓘ | $8.62B | |
Momentum (Price trend) | ||
| 3Y Return ⓘ | +51.83% | +61.68% |
| 12M Return (excl. last month) ⓘ | -6.76% | +12.58% |
| 6M Return ⓘ | -10.11% | 0.00% |
| Price vs. 200-Day MA ⓘ | -3.18% | +0.02% |
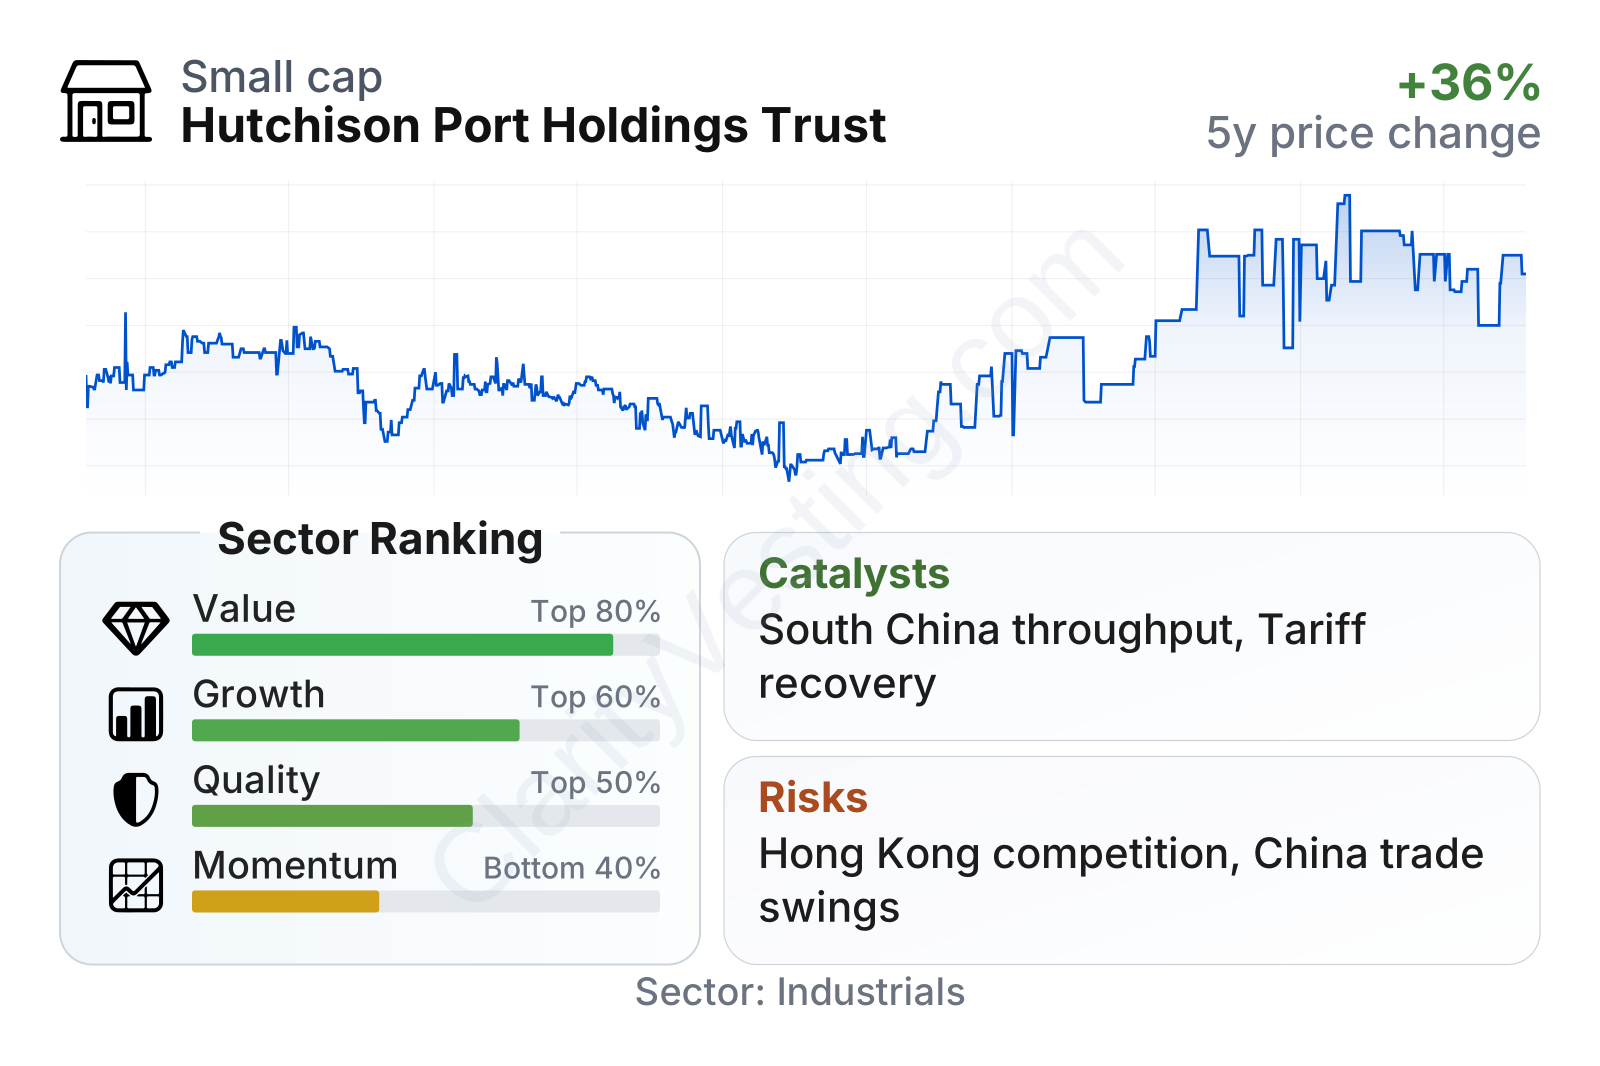
The share price has recovered strongly from its 2024 trough and is now well above levels seen in 2021 through 2023, although shorter-term momentum has been weaker than much of the broader industrial sector. The metrics table points to a mixed profile: valuation looks inexpensive relative to the sector, quality is supported by unusually strong operating margins of about 40%, and leverage appears manageable with net debt near 1.2 times EBITDA and interest coverage near 9.6 times. Growth indicators are less clean. Recent revenue growth is close to the sector median, but earnings and free cash flow trends over five years have been less consistent.
Growth
Container ports are not a high-growth technology niche, but they remain essential infrastructure for global trade. Over long periods, the sector tends to expand alongside merchandise trade, manufacturing supply chains, e-commerce fulfillment, and the continuing importance of Asian export hubs. For Hutchison Port Holdings Trust, the key question is not whether ports matter, but whether its specific ports can maintain throughput and pricing power in a very competitive regional network.
The trust’s strategy still makes industrial sense. Its assets sit in one of the world’s most important manufacturing and shipping corridors, linking Hong Kong and Shenzhen to international trade routes. That location gives the company a structural role in containerized trade, and it helps explain why operating margins remain far above many industrial peers. If throughput stabilizes and utilization improves, even moderate revenue growth can translate into solid operating profit because port assets have meaningful fixed-cost leverage.
A notable positive sign is that revenue has moved back up after the earlier downturn, with recent year-over-year growth around 9% to 10%, roughly in line with the sector median. The rebound in operating income and net income after 2023 also suggests that the worst part of the earnings compression may have passed. Dividend growth over five years has also been unusually strong, reflecting the trust structure’s income-oriented design, although distributions still depend on cash generation and balance-sheet discipline.
The main catalysts are tied to trade normalization and port utilization rather than to transformational acquisitions. Higher container throughput in South China, firmer terminal tariffs, better cargo mix, and lower financing pressure could all support further improvement. Any easing in interest costs would matter because financing expense has absorbed a significant portion of operating profit in recent years.
Risks
This article is for informational purposes only and does not constitute financial advice. Some content is AI-generated. See Disclaimer


