Stock Analysis · Huntsman Corporation (HUN)
Overview
Huntsman Corporation is a global chemicals manufacturer that makes specialty and differentiated chemical products used in construction, insulation, automotive parts, aerospace, electronics, textiles, packaging, coatings, adhesives, and household goods. In simple terms, Huntsman sells chemical ingredients that other companies use to make finished products. That makes its business closely tied to industrial activity, manufacturing demand, housing, and broader economic conditions.
Over the last several years, Huntsman has become more focused on specialty chemicals rather than basic commodity volumes. Its portfolio is organized around a few main operating segments, with Polyurethanes typically the largest contributor, followed by Performance Products and Advanced Materials. The Textile Effects business was sold in 2023, which simplified the company and reduced exposure to lower-margin activities.
Based on recent company reporting, Huntsman’s revenue mix is approximately:
- Polyurethanes: about 55% to 60% of revenue. This segment includes MDI and related systems used in insulation, construction materials, appliances, automotive components, and comfort products such as mattresses and seating.
- Performance Products: about 20% to 25% of revenue. This business sells amines, maleic anhydride, and other specialty ingredients used in fuels, lubricants, mining, energy, agrochemicals, and personal care.
- Advanced Materials: about 15% to 20% of revenue. This segment includes epoxy, composite, and formulation products used in aerospace, electronics, industrial tooling, coatings, and high-performance applications.
- Other and corporate items: a small remainder, including eliminations and activities outside the main segments.
Geographically, Huntsman operates across North America, Europe, and Asia, giving it broad exposure to industrial end markets but also making results sensitive to global manufacturing cycles, energy costs, and regional demand swings.
The business flow has become less favorable in recent years. Revenue has declined from around $8.0 billion in 2022 to about $5.7 billion in 2025, while gross profit and operating income have compressed sharply. Selling and administrative costs have been fairly stable, but weaker pricing and lower volumes have left much less profit after raw materials and operating expenses.
Key Figures
| Metric | Value | Sector ⓘ |
|---|---|---|
| Date | Oct 17, 2026 | |
| Context | ||
| Sector | Basic Materials | |
| Industry | Chemicals | |
| Market Cap ⓘ | $1.43B | |
| Beta ⓘ | 0.81 | |
Value (Cheapness) | ||
| P/E Ratio ⓘ | N/A | 16.90 |
| P/B Ratio ⓘ | 0.58 | 1.65 |
| FCF Yield ⓘ | -0.63% | 5.76% |
| Dividend Yield ⓘ | 6.36% | 2.13% |
| EBIT / EV ⓘ | -0.39% | 6.30% |
| PEG ⓘ | 2.22 | |
Growth (Business expansion) | ||
| Revenue Growth ⓘ | 14.10% | 11.10% |
| RPS Growth (5Y CAGR) ⓘ | -1.26% | 4.49% |
| EPS Growth (5Y CAGR) ⓘ | N/A | -13.47% |
| BVPS Growth (5Y CAGR) ⓘ | -6.11% | 5.51% |
| Margin Growth (5Y Trend) ⓘ | -19.11% | -1.54% |
| FCF Growth (5Y CAGR) ⓘ | -33.96% | 0.37% |
| DPS Growth (5Y CAGR) ⓘ | 4.18% | 6.08% |
Quality (Business durability) | ||
| ROIC (Latest) ⓘ | -0.56% | 9.26% |
| ROA (Latest) ⓘ | -2.40% | 4.91% |
| ROIC (5Y Median) ⓘ | 1.13% | 7.70% |
| ROA (5Y Median) ⓘ | 1.31% | 3.86% |
| Net Debt / EBIT (Latest) ⓘ | N/A | 1.40 |
| Net Debt / EBIT (5Y Median) ⓘ | 5.63 | 1.70 |
| Net Debt / EBITDA (Latest) ⓘ | 7.67 | 0.95 |
| Net Debt / Assets ⓘ | 29.97% | 13.69% |
| EBITDA / Interest ⓘ | 3.39 | 12.34 |
| Operating Margin (Latest) ⓘ | -0.25% | 13.20% |
| Operating Margin (5Y Median) ⓘ | 2.68% | 11.80% |
| Debt to Equity (Latest) ⓘ | 92.90% | 40.56% |
| Profit Margin (Latest) ⓘ | -3.05% | 6.43% |
| Free Cash Flow (Latest) ⓘ | -$9.00M | |
Momentum (Price trend) | ||
| 3Y Return ⓘ | -58.30% | +68.89% |
| 12M Return (excl. last month) ⓘ | -10.85% | +30.21% |
| 6M Return ⓘ | -38.36% | -4.16% |
| Price vs. 200-Day MA ⓘ | -29.41% | -1.27% |
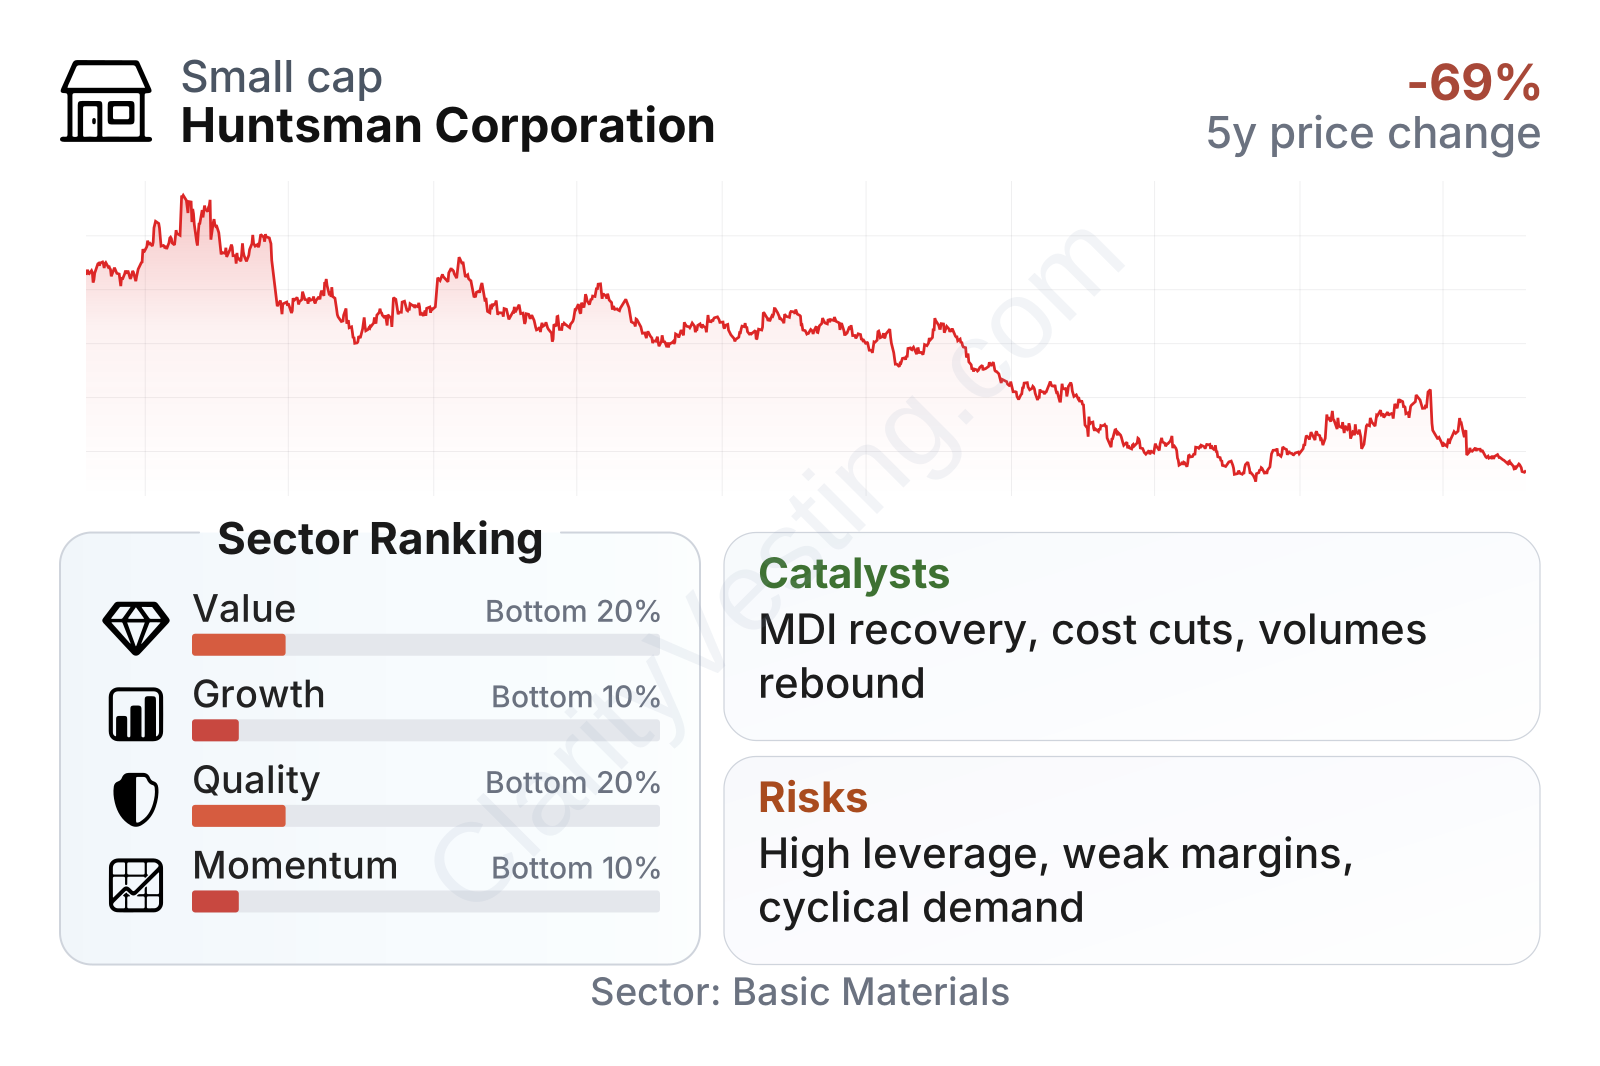
Huntsman is now a relatively small public chemicals company by market value, and the stock has been under clear pressure for several years. The share price is far below its 2022 level, which matches the deterioration in earnings power and profitability. In the factor table, the company ranks weakly versus the broader materials sector on value, growth, quality, and momentum. The low price-to-book ratio suggests the market is assigning limited confidence to the current asset base, while the elevated dividend yield mainly reflects a depressed share price rather than strong operating performance. The combination of negative free cash flow yield, weak returns on capital, and poor momentum shows that the market is still waiting for a more convincing recovery.
Growth
Huntsman operates in sectors that can grow over the long run, but they are not smooth growth markets. Polyurethanes benefit from insulation demand, energy efficiency standards, lightweighting in vehicles, and construction materials. Advanced Materials has exposure to higher-value niches such as aerospace, electronics, and composites. These areas can support long-term demand, especially where customers need performance rather than just low-cost bulk chemicals.
The company’s strategy broadly makes sense for future growth because it emphasizes differentiated products, downstream formulations, and applications where technical know-how matters more. That is usually a better place to compete than commodity chemicals, where prices can swing quickly and margins often collapse during weak cycles. Huntsman has also continued to reshape its portfolio over time through divestitures and cost actions.
Even so, the near-term picture remains mixed. Revenue growth has recently turned positive again after a long stretch of declines, which suggests the business may be moving off a low base. That matters because chemicals companies often recover in phases: first volumes stabilize, then pricing improves, and only later do margins rebuild.
The recent pattern points to early stabilization rather than a full recovery. Revenue fell sharply through much of 2023 and 2025, but the latest year-over-year readings show a return to modest growth and then a stronger rebound of around the low teens by mid-2026. That is a constructive change, although one good period is not enough to prove a sustained upswing.
Cash generation tells a similar story. Free cash flow has dropped dramatically from the high levels seen earlier in the cycle, but it has improved from very weak levels. That suggests Huntsman is still working through a difficult part of the cycle rather than expanding from a position of strength.
A key catalyst is any broader recovery in industrial production, housing-related materials, and European manufacturing demand, since Huntsman has meaningful exposure to all three. Another potential support is margin recovery if raw material costs, plant utilization, and selling prices move in a more favorable direction. Company-hosted updates in 2026 have also highlighted restructuring, portfolio optimization, and cost discipline, which could help earnings if end markets improve at the same time.
Risks
This article is for informational purposes only and does not constitute financial advice. Some content is AI-generated. See Disclaimer


