Stock Analysis · Hub Group Inc (HUBG)
Overview
Hub Group Inc is a transportation and logistics company that helps shippers move goods across North America. Its role is mainly to organize and manage freight rather than to operate as a railroad or a global ocean carrier. The company combines intermodal service, truck brokerage, dedicated trucking, warehousing, and other supply chain services for customers in retail, consumer goods, industrial, and similar end markets.
In simple terms, Hub Group acts as a middle layer between companies that need to move products and the transportation networks that actually carry them. A customer may use Hub Group to arrange container moves by rail, local pickup and delivery by truck, managed transportation planning, final-mile distribution, or warehousing support. That makes the business tied to shipping volumes, freight prices, and overall economic activity.
Based on the company’s recent annual reporting structure, revenue is primarily generated from transportation and logistics services, with intermodal remaining the largest activity but with meaningful contributions from trucking and logistics offerings. Precise percentages can shift from year to year depending on freight demand and pricing, but the revenue mix is broadly centered on the following areas:
- Intermodal transportation: approximately 45% to 55% of revenue. This includes freight moved in containers using rail for the long-haul portion and trucks for pickup and delivery.
- Truck brokerage and transportation solutions: approximately 25% to 35% of revenue. This includes arranging truckload, less-than-truckload, and other over-the-road freight through third-party carriers.
- Dedicated transportation: approximately 10% to 20% of revenue. This generally covers committed trucking capacity and fleet-based solutions for specific customer needs.
- Logistics, warehousing, and managed services: approximately 5% to 15% of revenue. This includes supply chain design, managed transportation, fulfillment, and warehouse-related services.
One notable point in the business profile is that Hub Group is asset-light in many areas, meaning it relies significantly on purchased transportation and partner networks instead of owning every part of the system. That can reduce capital intensity, but it also limits control over pricing and service during tight freight markets.
The business flow over the last few years shows how cyclical this model can be. Revenue and profits surged during the unusually strong freight market in 2022, then retreated as shipping demand softened and pricing normalized. Even so, the company remained profitable and cash generative, which matters for long-term financial resilience.
The operating profile shows a sharp earnings peak in 2022 followed by a normalization phase in 2023 and 2024. That pattern is common in freight and logistics: revenue can remain large while margins move around much more dramatically because transportation costs and pricing power change quickly.
Key Figures
| Metric | Value | Sector ⓘ |
|---|---|---|
| Date | Oct 17, 2026 | |
| Context | ||
| Sector | Industrials | |
| Industry | Integrated Freight & Logistics | |
| Market Cap ⓘ | $1.61B | |
| Beta ⓘ | 1.24 | |
Value (Cheapness) | ||
| P/E Ratio ⓘ | 15.16 | 22.10 |
| P/B Ratio ⓘ | 0.96 | 1.97 |
| FCF Yield ⓘ | 7.03% | 6.38% |
| Dividend Yield ⓘ | 1.88% | 1.94% |
| EBIT / EV ⓘ | 6.52% | 4.79% |
| PEG ⓘ | 1.92 | |
Growth (Business expansion) | ||
| Revenue Growth ⓘ | -5.30% | 9.30% |
| RPS Growth (5Y CAGR) ⓘ | 5.51% | 7.81% |
| EPS Growth (5Y CAGR) ⓘ | -30.81% | -13.06% |
| BVPS Growth (5Y CAGR) ⓘ | 10.95% | 6.14% |
| Margin Growth (5Y Trend) ⓘ | 0.71% | 0.88% |
| FCF Growth (5Y CAGR) ⓘ | 24.56% | 11.01% |
| DPS Growth (5Y CAGR) ⓘ | N/A | 9.48% |
Quality (Business durability) | ||
| ROIC (Latest) ⓘ | 6.01% | 10.84% |
| ROA (Latest) ⓘ | 3.64% | 5.41% |
| ROIC (5Y Median) ⓘ | 9.89% | 9.38% |
| ROA (5Y Median) ⓘ | 5.74% | 4.95% |
| Net Debt / EBIT (Latest) ⓘ | 2.53 | 2.08 |
| Net Debt / EBIT (5Y Median) ⓘ | 1.74 | 2.27 |
| Net Debt / EBITDA (Latest) ⓘ | 1.12 | 1.39 |
| Net Debt / Assets ⓘ | 13.07% | 19.28% |
| EBITDA / Interest ⓘ | 26.55 | 9.58 |
| Operating Margin (Latest) ⓘ | 4.01% | 10.50% |
| Operating Margin (5Y Median) ⓘ | 5.18% | 10.29% |
| Debt to Equity (Latest) ⓘ | 29.30% | 65.48% |
| Profit Margin (Latest) ⓘ | 2.82% | 6.67% |
| Free Cash Flow (Latest) ⓘ | $113.42M | |
Momentum (Price trend) | ||
| 3Y Return ⓘ | -29.78% | +61.68% |
| 12M Return (excl. last month) ⓘ | -1.08% | +12.58% |
| 6M Return ⓘ | -33.69% | 0.00% |
| Price vs. 200-Day MA ⓘ | -35.74% | +0.02% |
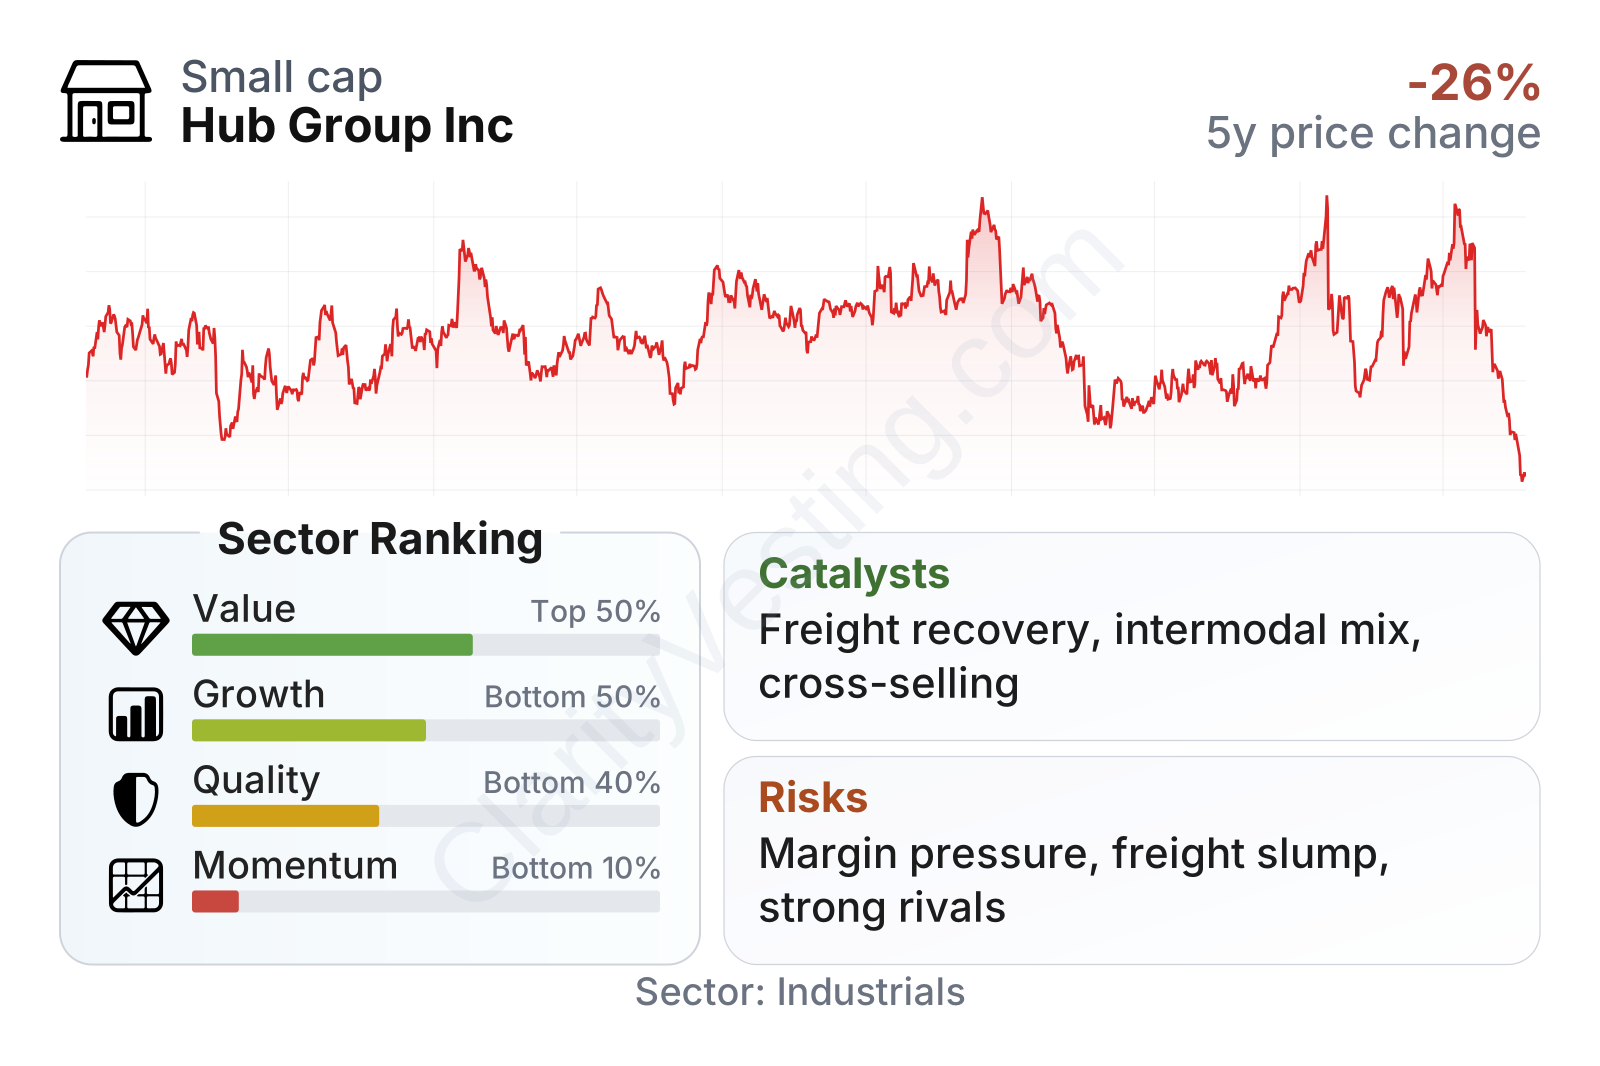
Hub Group sits in the mid-cap range and has a share price history that reflects a cyclical business rather than a steady compounder. On the factor breakdown, valuation looks more favorable than growth, while momentum is clearly weak. Relative to the broader industrial sector, the company appears cheaper on earnings and book value, carries modest leverage, and still produces free cash flow, but recent expansion has lagged and profitability remains below sector norms.
The balance between strengths and weaknesses is important here. The company does not stand out for fast current growth or high margins, yet it does show a combination of a manageable debt load, solid interest coverage, and a valuation profile that is not stretched compared with many peers.
Growth
Hub Group operates in a sector with long-term structural relevance. Freight transportation and supply chain management are essential to retail, manufacturing, and e-commerce. Over time, demand for efficient goods movement should keep growing with population, consumption, and more complex distribution networks. Intermodal also has a durable place in that trend because rail-assisted freight can be cheaper and more fuel-efficient than long-haul trucking on certain lanes.
That said, the sector is not a straight-line growth market. It moves in cycles tied to inventory levels, consumer demand, industrial production, and freight capacity. Hub Group’s recent revenue pattern reflects that reality more than any structural breakdown in the business.
Recent year-over-year revenue comparisons have been negative for an extended period, although the declines became less severe before weakening again. This suggests the company has been operating through a freight downturn rather than a collapse in relevance. For long-term analysis, the key question is whether volumes and service mix recover once the transportation cycle improves.
Management’s strategy still makes sense for future growth. The company has continued building a broader logistics platform instead of depending only on intermodal. That matters because customers increasingly want integrated transportation management, dedicated solutions, and warehousing support from fewer providers. If Hub Group can cross-sell those services across its existing customer base, growth can come not only from freight volume recovery but also from deeper customer relationships.
Cash generation remains an encouraging part of the picture. Free cash flow rose strongly over a multi-year stretch before coming down from a high base, and it remains positive. For a cyclical logistics company, staying cash generative during a softer freight environment is a meaningful sign of operating discipline.
A practical catalyst is any improvement in North American freight conditions. If inventories normalize, truck capacity tightens, or intermodal demand improves, Hub Group could benefit from better pricing and higher network utilization. Another catalyst is continued adoption of outsourced logistics and managed transportation services by shippers looking to simplify their supply chains and reduce cost.
Recent company updates have also pointed to ongoing efforts around network efficiency, service diversification, and customer wins in dedicated and logistics offerings. Those initiatives do not remove cyclicality, but they can make future recoveries broader than a simple rebound in one service line.
Risks
This article is for informational purposes only and does not constitute financial advice. Some content is AI-generated. See Disclaimer


