Stock Analysis · Hubbell Inc (HUBB)
Overview
Hubbell Inc. is an electrical equipment manufacturer focused on the infrastructure that moves and manages power. Its products are used by electric utilities, communications providers, industrial facilities, and non-residential buildings. In simple terms, Hubbell sells the components that help deliver electricity from the grid to end users and the devices that make buildings safer and more efficient.
The company operates through two main segments. Based on recent annual reporting, revenue is roughly split as follows:
- Utility Solutions: about 60% of revenue — equipment used by electric utilities and communications customers, including transmission, distribution, substation, grid hardening, connectors, arresters, enclosures, and related products.
- Electrical Solutions: about 40% of revenue — products used in commercial, industrial, and institutional buildings, including wiring devices, connectors, harsh and hazardous location products, lighting controls, power management products, and other electrical components.
That mix matters because Utility Solutions is tied to long-cycle grid investment, while Electrical Solutions is more exposed to construction, industrial activity, and maintenance spending. Over the last several years, the business has also become more profitable, with revenue rising from a little above $4.1 billion in 2021 to about $5.8 billion in 2025, while net income more than doubled over the same period. Gross profit and operating income have expanded faster than sales, which points to a favorable product mix and stronger execution.
The overall picture is a company that combines a steady installed-base business with exposure to large infrastructure upgrades in the power system.
Key Figures
| Metric | Value | Sector ⓘ |
|---|---|---|
| Date | Oct 10, 2026 | |
| Context | ||
| Sector | Industrials | |
| Industry | Electrical Equipment & Parts | |
| Market Cap ⓘ | $25.65B | |
| Beta ⓘ | 0.85 | |
Value (Cheapness) | ||
| P/E Ratio ⓘ | 28.74 | 22.32 |
| P/B Ratio ⓘ | 6.48 | 1.98 |
| FCF Yield ⓘ | 3.51% | 6.34% |
| Dividend Yield ⓘ | 1.16% | 1.95% |
| EBIT / EV ⓘ | 4.15% | 4.71% |
| PEG ⓘ | 1.95 | |
Growth (Business expansion) | ||
| Revenue Growth ⓘ | 15.30% | 9.25% |
| RPS Growth (5Y CAGR) ⓘ | 9.22% | 7.75% |
| EPS Growth (5Y CAGR) ⓘ | -3.04% | -13.37% |
| BVPS Growth (5Y CAGR) ⓘ | 15.28% | 6.12% |
| Margin Growth (5Y Trend) ⓘ | 8.27% | 0.81% |
| FCF Growth (5Y CAGR) ⓘ | 17.84% | 11.01% |
| DPS Growth (5Y CAGR) ⓘ | 7.78% | 9.48% |
Quality (Business durability) | ||
| ROIC (Latest) ⓘ | 14.33% | 10.70% |
| ROA (Latest) ⓘ | 9.31% | 5.38% |
| ROIC (5Y Median) ⓘ | 17.07% | 9.26% |
| ROA (5Y Median) ⓘ | 11.44% | 4.94% |
| Net Debt / EBIT (Latest) ⓘ | 4.06 | 2.08 |
| Net Debt / EBIT (5Y Median) ⓘ | 1.77 | 2.29 |
| Net Debt / EBITDA (Latest) ⓘ | 3.40 | 1.43 |
| Net Debt / Assets ⓘ | 42.16% | 19.34% |
| EBITDA / Interest ⓘ | 15.15 | 9.54 |
| Operating Margin (Latest) ⓘ | 19.76% | 10.34% |
| Operating Margin (5Y Median) ⓘ | 19.17% | 10.29% |
| Debt to Equity (Latest) ⓘ | 136.95% | 65.52% |
| Profit Margin (Latest) ⓘ | 14.49% | 6.63% |
| Free Cash Flow (Latest) ⓘ | $901.40M | |
Momentum (Price trend) | ||
| 3Y Return ⓘ | +59.81% | +61.33% |
| 12M Return (excl. last month) ⓘ | +6.95% | +14.82% |
| 6M Return ⓘ | -4.20% | +3.53% |
| Price vs. 200-Day MA ⓘ | -2.19% | +0.88% |
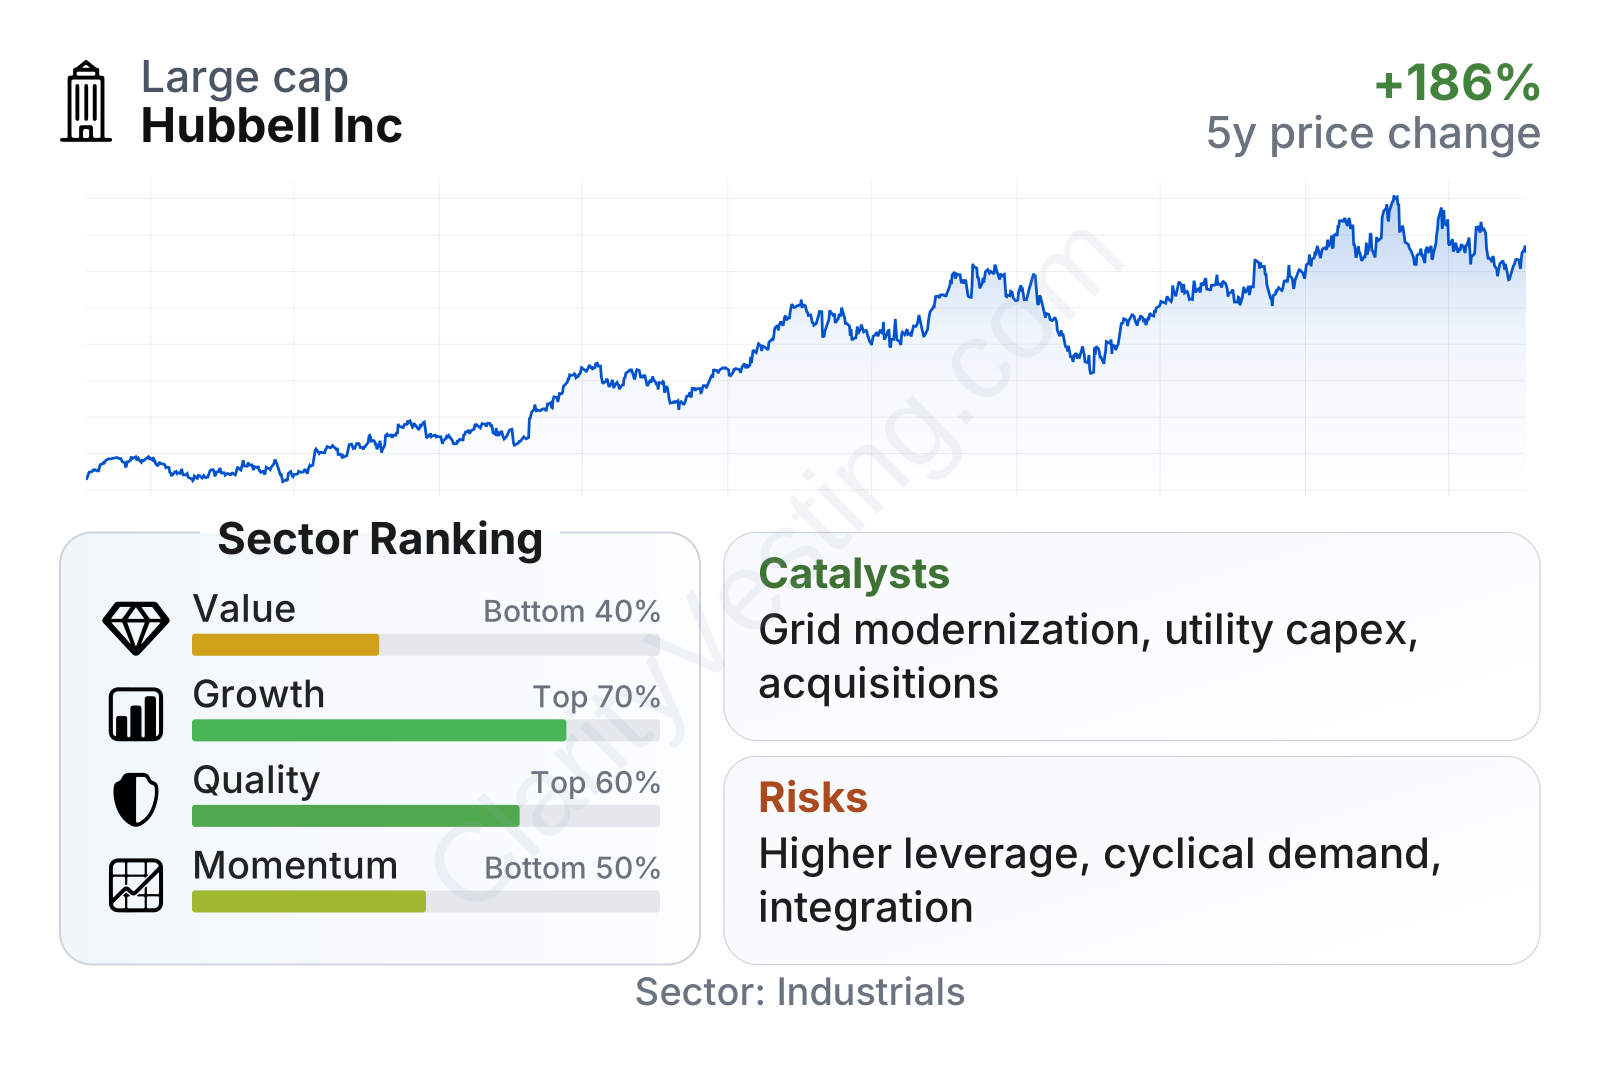
Hubbell sits in the large-cap range and shows a fairly moderate stock volatility profile, with a beta below 1. On growth and operating quality, the business compares well with much of the industrial sector: revenue growth is running above the sector median, returns on capital are strong, and margins are clearly higher than typical peers. The weaker areas are valuation and recent share-price momentum, with the stock trading at richer multiples than the sector and recent market performance trailing many industrial names.
Cash generation remains an important strength. Free cash flow has climbed steadily over the past several years, and profitability metrics suggest Hubbell has been turning revenue into earnings more efficiently than many competitors. At the same time, leverage metrics have become less comfortable recently, which is one of the main items to watch beneath otherwise solid headline performance.
Growth
Hubbell operates in a sector with long-term structural support. In the United States, electric grids need modernization, resilience upgrades, and more capacity. Utilities are investing in transmission and distribution networks to manage aging infrastructure, stronger weather-related demands, electrification, and rising power needs from data centers and industrial activity. Those themes support demand for many of Hubbell’s utility-facing products.
Its strategy also makes sense in that context. Hubbell is positioned in products that are essential rather than optional: connectors, protection devices, enclosures, and grid hardware are small parts of a utility project’s total budget, but they are critical for reliability and safety. This tends to create recurring demand and can provide pricing resilience when customers prioritize dependable supply.
Recent revenue trends suggest the company has moved beyond a purely cyclical rebound. Growth slowed in parts of 2024 and early 2025, but more recent year-over-year comparisons re-accelerated into the low-to-mid teens. That is a healthy level for an industrial business of Hubbell’s size and indicates that end-market demand has remained supportive.
Another encouraging sign is cash generation. Free cash flow has advanced from roughly $350 million a few years ago to around $900 million on a trailing basis. That matters because it gives Hubbell flexibility to fund acquisitions, invest in operations, repay debt, and continue shareholder distributions without relying heavily on outside financing.
A notable catalyst in recent years has been the broad utility spending cycle in North America, especially around grid hardening and reliability. Hubbell has also used acquisitions to strengthen its utility and electrification portfolio. When these deals are integrated well, they can expand product breadth and deepen customer relationships. The company’s margin improvement over time suggests management has so far been able to capture operating benefits from scale and portfolio mix.
Risks
This article is for informational purposes only and does not constitute financial advice. Some content is AI-generated. See Disclaimer