Stock Analysis · H2O America (HTO)
Overview
H2O America, formerly known as SJW Group, is a regulated water utility company. It provides drinking water service, wastewater service, and in some areas recycled water service. The company operates through local utility subsidiaries in several states, with California and Texas as especially important markets. Its business is straightforward: it owns water infrastructure such as wells, treatment plants, storage, and pipelines, delivers essential water service to homes and businesses, and then earns revenue under rates approved by regulators.
For long-term analysis, the key point is that this is not a fast-changing technology business. It is an infrastructure-heavy utility whose economics are shaped mainly by customer growth, approved rate increases, operating efficiency, and the pace of capital investment that can later be included in its regulated asset base.
Based on recent company reporting, revenue is overwhelmingly tied to regulated utility operations. A practical breakdown is:
- Water utility service: approximately 85% to 90% — retail water delivery to residential, commercial, industrial, and public customers.
- Wastewater utility service: approximately 8% to 12% — sewer collection and treatment operations, mainly in Texas and certain other service areas.
- Other utility and related activities: approximately 1% to 5% — recycled water, service fees, balancing and surcharge mechanisms, and limited non-core items.
This is a fairly concentrated model, which is normal for a regulated water utility. It means the company is less dependent on economic cycles than many industries, but more dependent on regulation, local population trends, and infrastructure spending. Over the last several years, revenue and operating income have generally moved upward, showing that the core business has been expanding even while financing costs have risen.
The financial flow over time points to a business that has been growing revenue steadily, with operating income also improving. One notable change is that interest expense has increased meaningfully, which matters because utilities rely heavily on debt to fund long-lived infrastructure.
Key Figures
| Metric | Value | Sector ⓘ |
|---|---|---|
| Date | Oct 17, 2026 | |
| Context | ||
| Sector | Utilities | |
| Industry | Utilities - Regulated Water | |
| Market Cap ⓘ | $2.45B | |
| Beta ⓘ | 0.32 | |
Value (Cheapness) | ||
| P/E Ratio ⓘ | 20.67 | 17.28 |
| P/B Ratio ⓘ | 1.27 | 1.51 |
| FCF Yield ⓘ | -17.49% | 0.65% |
| Dividend Yield ⓘ | 2.93% | 3.77% |
| EBIT / EV ⓘ | 4.36% | 5.01% |
| PEG ⓘ | 2.68 | |
Growth (Business expansion) | ||
| Revenue Growth ⓘ | 6.20% | 6.10% |
| RPS Growth (5Y CAGR) ⓘ | 3.61% | 3.87% |
| EPS Growth (5Y CAGR) ⓘ | -16.42% | -11.30% |
| BVPS Growth (5Y CAGR) ⓘ | 5.31% | 4.23% |
| Margin Growth (5Y Trend) ⓘ | 4.26% | 3.57% |
| FCF Growth (5Y CAGR) ⓘ | N/A | -8.84% |
| DPS Growth (5Y CAGR) ⓘ | 4.81% | 4.84% |
Quality (Business durability) | ||
| ROIC (Latest) ⓘ | N/A | 6.53% |
| ROA (Latest) ⓘ | 2.05% | 3.20% |
| ROIC (5Y Median) ⓘ | N/A | 5.95% |
| ROA (5Y Median) ⓘ | 2.09% | 2.75% |
| Net Debt / EBIT (Latest) ⓘ | 9.33 | 7.13 |
| Net Debt / EBIT (5Y Median) ⓘ | 11.06 | 7.23 |
| Net Debt / EBITDA (Latest) ⓘ | 5.59 | 4.31 |
| Net Debt / Assets ⓘ | 32.87% | 38.42% |
| EBITDA / Interest ⓘ | 4.38 | 4.58 |
| Operating Margin (Latest) ⓘ | 23.12% | 20.83% |
| Operating Margin (5Y Median) ⓘ | 23.29% | 20.08% |
| Debt to Equity (Latest) ⓘ | 102.58% | 137.69% |
| Profit Margin (Latest) ⓘ | 12.91% | 11.37% |
| Free Cash Flow (Latest) ⓘ | -$428.07M | |
Momentum (Price trend) | ||
| 3Y Return ⓘ | +6.12% | +52.37% |
| 12M Return (excl. last month) ⓘ | +29.69% | +8.84% |
| 6M Return ⓘ | +0.08% | -3.95% |
| Price vs. 200-Day MA ⓘ | -0.90% | -0.79% |
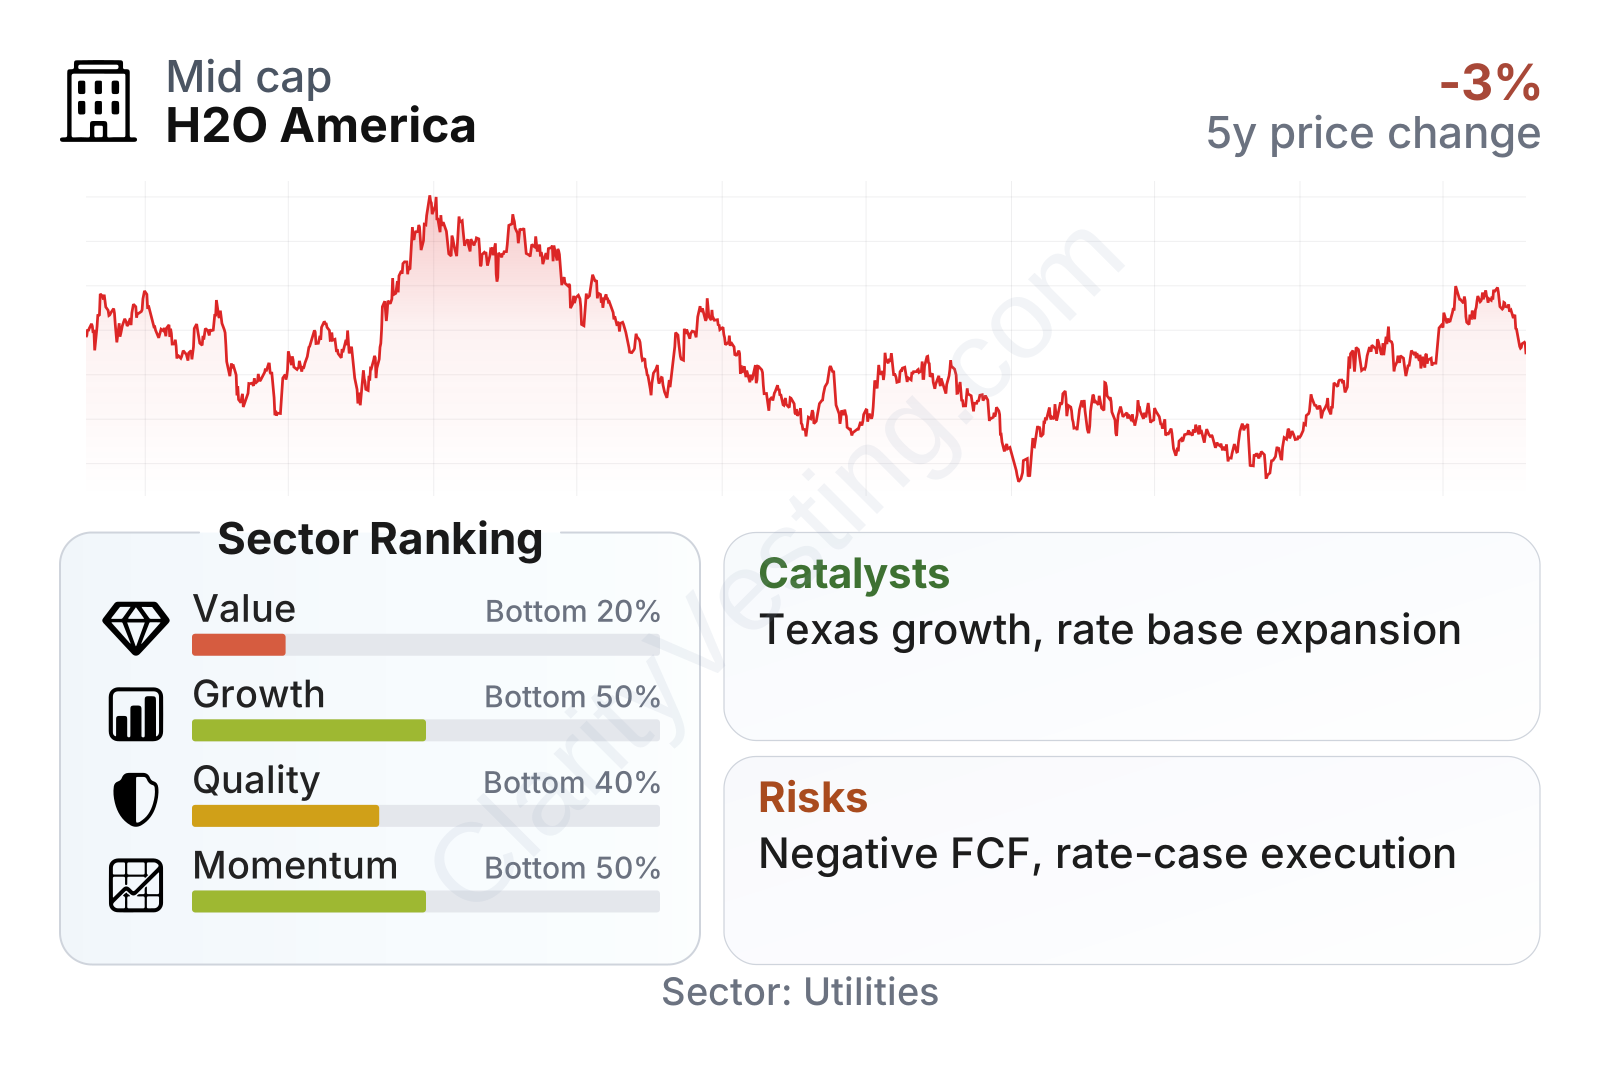
H2O America is a mid-sized regulated water utility with a low-beta profile, meaning the stock has tended to move less than the broader market. The recent factor picture is mixed. Valuation sits in the weaker part of the sector because the earnings multiple is above the utility median while free cash flow is deeply negative. Growth is not weak in revenue terms, but earnings growth over a multi-year period has been less impressive. Quality metrics are also mixed: margins are solid, but leverage remains meaningful and cash generation is under pressure because of high capital spending.
The stock performance chart shows a company whose share price has recovered strongly from its 2025 lows and is now well above those levels. That improvement has been stronger than much of the utility group over the last 6 to 12 months, even though the longer three-year return still trails the sector median.
Growth
The regulated water utility sector is generally considered a favorable long-term area because water systems are essential, difficult to replace, and in need of constant modernization. In the United States, aging pipes, treatment upgrades, drought resilience projects, and population shifts toward faster-growing regions all support long-duration investment needs. That creates room for utilities to expand their regulated asset base, which is often the main driver of future earnings.
H2O America’s strategy fits that pattern. The company has been investing heavily in infrastructure, and that has supported a steady rise in revenue per share over the last five years. Growth has not been spectacular, but it has been consistent, which is often more relevant for a regulated utility than short bursts of expansion.
The revenue-per-share trend suggests that the company has been adding growth without relying only on issuing large amounts of new equity. The pace is modest rather than rapid, but it is aligned with what many long-term observers look for in a water utility: gradual expansion supported by system investment and customer demand.
Another positive point is geography. H2O America has exposure to states where water infrastructure demands are high and, in some cases, population growth is supportive. Texas is particularly important because it offers growth opportunities tied to development and new connections, while California remains a large and strategically valuable market despite its regulatory and drought-related complexity.
Public company materials in 2026 also continue to emphasize capital investment, rate case execution, and system resiliency. Those are credible catalysts because approved investment can translate into a larger rate base over time. In utility businesses, that matters more than short-term volume growth.
The main complication is cash flow. Free cash flow has become more negative as investment spending has accelerated. That is not automatically a sign of operating weakness in this sector, since utilities often spend heavily upfront and recover returns over long periods. Still, it means growth is currently capital intensive and depends on continued access to debt and equity funding at workable costs.
Risks
This article is for informational purposes only and does not constitute financial advice. Some content is AI-generated. See Disclaimer


