Stock Analysis · Hercules Capital Inc (HTGC)
Overview
Hercules Capital is a specialty finance company focused on lending to venture-backed businesses. In simple terms, it provides loans to companies that are often too young, too innovative, or too specialized to rely only on traditional bank financing. Its borrowers are typically in technology, life sciences, and sustainable or growth-oriented industries. Hercules is organized as a business development company, or BDC, which means it is designed to finance smaller and mid-sized businesses and distribute a large share of its taxable income to shareholders.
The business model is mostly based on earning interest and fees on loans. Hercules mainly lends senior secured debt, which usually gives it a higher claim on assets than equity holders if a borrower runs into trouble. It may also receive warrants or small equity-related upside in some portfolio companies, but that is a secondary part of the model rather than the core engine.
Based on the company’s recent filings, revenue is primarily generated from investment income tied to its debt portfolio. The broad mix can be summarized as follows:
- Interest income from debt investments: approximately 85% to 90% of total investment income. This is the main source and includes cash interest earned on loans made to portfolio companies.
- Fee income: approximately 5% to 10%. This can include origination fees, end-of-term fees, prepayment fees, and other lending-related charges.
- Dividend income and other investment income: usually a low-single component when present, often linked to structured investments or special situations.
- Realized and unrealized gains: variable and not a stable operating source. These can come from warrants, equity positions, or valuation changes in the investment portfolio.
That concentration is important for long-term readers: Hercules is not a broadly diversified asset manager collecting recurring management fees from outside clients. It is much closer to a specialized lender whose results depend on loan volume, credit quality, funding costs, and the health of the venture ecosystem.
Profitability has been strong in recent years, with revenue and net income recovering sharply after the 2022 slowdown. The business has also kept operating expenses relatively controlled compared with revenue, which helps explain its unusually high margins for a financial company.
The overall financial picture shows a lender with a wide spread between revenue and operating expenses. Revenue dipped in 2022, then expanded strongly in 2023 and again by 2025, while administrative costs rose much more slowly. That points to operating leverage, although interest expense has also moved higher as the balance sheet expanded.
Key Figures
| Metric | Value | Sector ⓘ |
|---|---|---|
| Date | Oct 03, 2026 | |
| Context | ||
| Sector | Financial Services | |
| Industry | Asset Management | |
| Market Cap ⓘ | $3.15B | |
| Beta ⓘ | 0.75 | |
Value (Cheapness) | ||
| P/E Ratio ⓘ | 8.40 | 12.60 |
| P/B Ratio ⓘ | 1.49 | 1.23 |
| FCF Yield ⓘ | 0.27% | 10.16% |
| Dividend Yield ⓘ | 9.43% | 2.96% |
| EBIT / EV ⓘ | 8.08% | 7.77% |
| PEG ⓘ | 0.52 | |
Growth (Business expansion) | ||
| Revenue Growth ⓘ | 8.50% | 9.50% |
| RPS Growth (5Y CAGR) ⓘ | 1.27% | 12.10% |
| EPS Growth (5Y CAGR) ⓘ | -10.42% | -9.45% |
| BVPS Growth (5Y CAGR) ⓘ | 0.20% | 5.01% |
| Margin Growth (5Y Trend) ⓘ | 10.48% | -4.07% |
| FCF Growth (5Y CAGR) ⓘ | N/A | 4.96% |
| DPS Growth (5Y CAGR) ⓘ | 2.54% | 8.79% |
Quality (Business durability) | ||
| ROIC (Latest) ⓘ | 7.48% | 9.60% |
| ROE (Latest) ⓘ | 17.17% | 13.84% |
| ROA (Latest) ⓘ | 8.42% | 1.53% |
| ROIC (5Y Median) ⓘ | 6.89% | 7.86% |
| ROE (5Y Median) ⓘ | 13.87% | 12.20% |
| ROA (5Y Median) ⓘ | 7.26% | 1.29% |
| Net Debt / EBIT (Latest) ⓘ | 5.27 | 0.91 |
| Net Debt / EBIT (5Y Median) ⓘ | 6.37 | 0.74 |
| Net Debt / EBITDA (Latest) ⓘ | 5.27 | 0.97 |
| Operating Margin (Latest) ⓘ | 75.32% | 22.12% |
| Operating Margin (5Y Median) ⓘ | 61.03% | 24.39% |
| Debt to Equity (Latest) ⓘ | 103.33% | 60.37% |
| Profit Margin (Latest) ⓘ | 67.68% | 26.62% |
| Free Cash Flow (Latest) ⓘ | $8.43M | |
Momentum (Price trend) | ||
| 3Y Return ⓘ | +46.24% | +89.23% |
| 12M Return (excl. last month) ⓘ | +1.25% | +17.35% |
| 6M Return ⓘ | +22.76% | +10.00% |
| Price vs. 200-Day MA ⓘ | +7.87% | +3.73% |
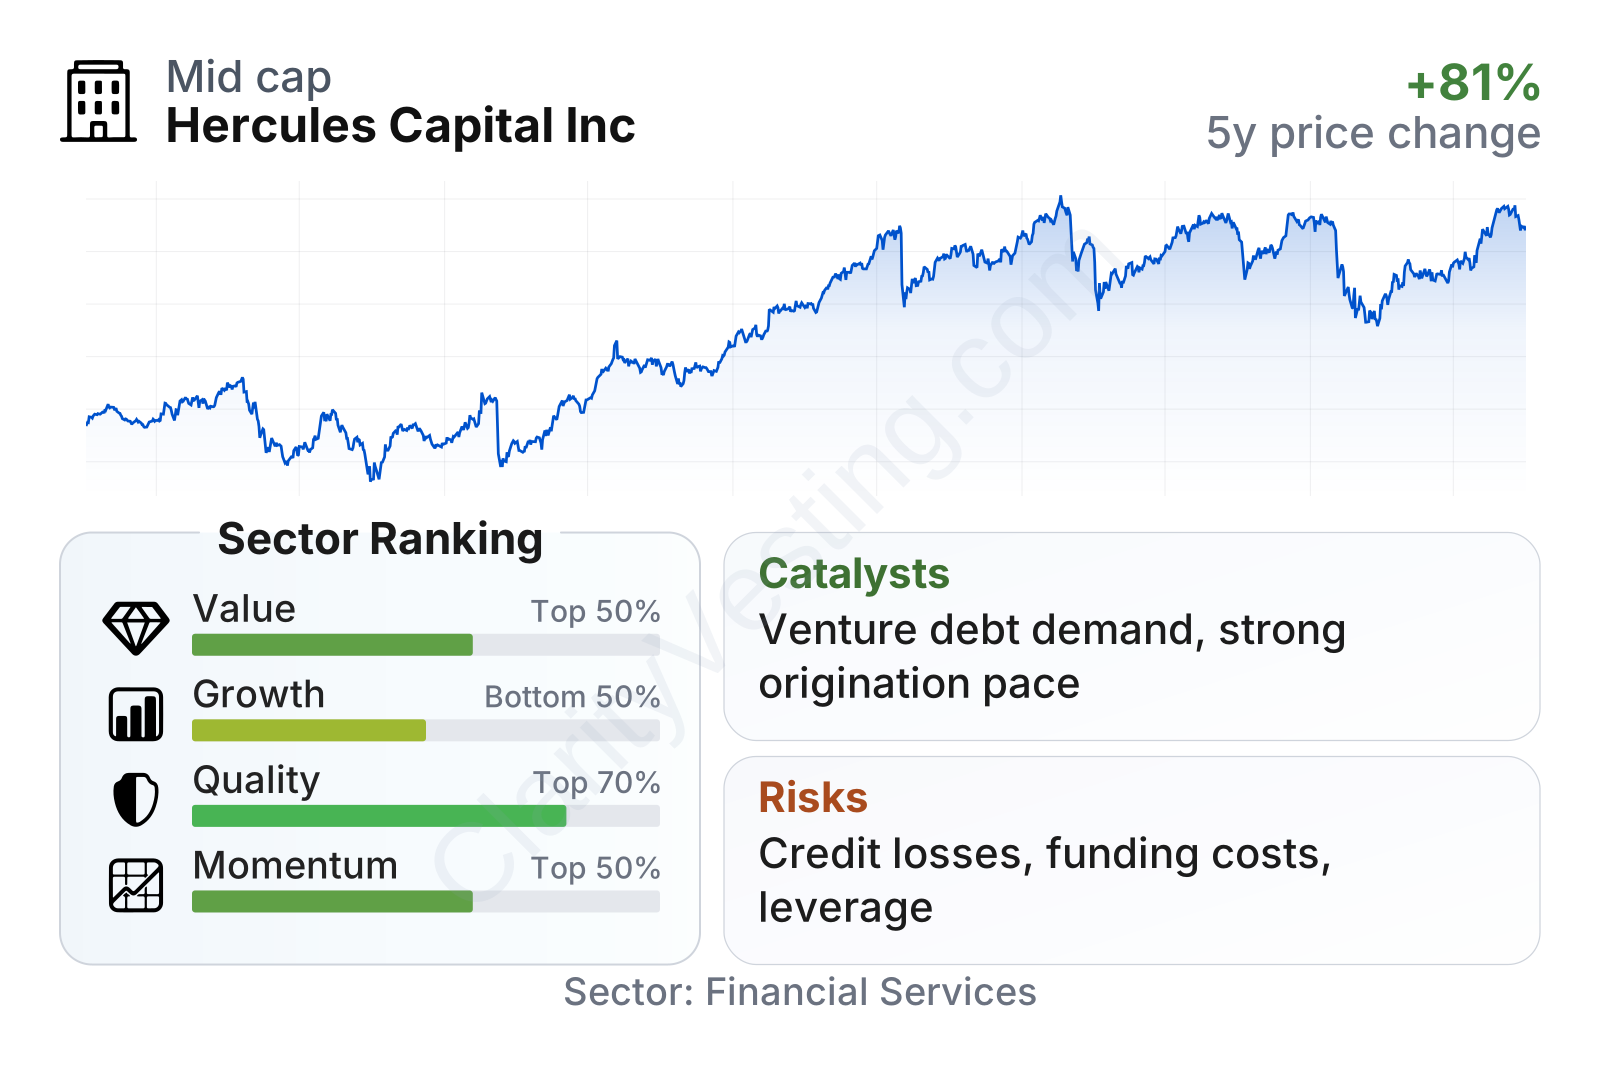
Hercules Capital sits in the mid-cap range, with lower share-price volatility than the broader market as shown by a beta below 1. On valuation, its earnings multiple is below the sector median, while its price-to-book ratio is modestly above the sector median. Income remains a major part of the profile, with a trailing dividend yield around 9% to 10%, far above the sector median. Quality metrics are generally solid, especially return on equity, return on assets, profit margin, and operating margin. The weaker area is growth: recent revenue growth has been positive, but longer-term growth in earnings per share and book value per share has been limited compared with the broader financial sector.
Growth
Hercules operates in a part of finance that benefits from long-term demand for private capital. Many venture-backed companies want funding without raising more equity at unfavorable valuations, and banks have become more cautious with specialized growth lending. That creates room for non-bank lenders with underwriting expertise, industry relationships, and a reputation for moving quickly. In that sense, the company is tied to a growing segment: venture debt and structured financing for innovation-led businesses.
The strategy is coherent for future expansion. Hercules focuses on industries where specialized knowledge matters, especially software, healthcare, biotechnology, and adjacent growth sectors. That specialization can help with loan sourcing and pricing. The model also tends to benefit when borrowers prefer debt over issuing more shares, particularly after periods when startup valuations have been pressured.
Another support for growth is scale. As an established BDC in venture lending, Hercules has a recognized platform, long operating history, access to the public debt and equity markets, and relationships with sponsors, venture firms, and founders. Those advantages can help it win repeat business and structure larger transactions than smaller rivals.
Earnings per share climbed strongly from 2021 through 2023, then eased somewhat in 2024 and 2025. That pattern suggests the company already captured a major benefit from the higher-rate environment and portfolio growth, but future gains may be less linear. The recent level still points to a business earning materially more than it did a few years ago, even if the pace has normalized.
Book value per share has been more stable than earnings, with improvement in 2023 followed by some softening afterward. For a lender, that matters because book value gives a rough indication of how much capital backs the portfolio. The limited long-term growth here suggests Hercules has generated income well, but capital compounding on a per-share basis has been more modest.
Recent company disclosures in 2026 continued to emphasize active originations, repayments, and portfolio management rather than a major change in strategy. The most meaningful catalyst remains straightforward: if venture-backed borrowing demand stays healthy and credit performance remains controlled, Hercules can continue deploying capital at attractive yields. A secondary catalyst is any improvement in exit markets, such as IPOs or acquisitions, which can strengthen borrower liquidity and increase the value of warrants and equity-related positions.
Risks
This article is for informational purposes only and does not constitute financial advice. Some content is AI-generated. See Disclaimer


