Stock Analysis · Heritage Insurance Hldgs Inc (HRTG)
Overview
Heritage Insurance Holdings is a property and casualty insurer focused mainly on personal residential coverage in catastrophe-exposed coastal states. In simple terms, it collects premiums from homeowners, condominium owners, and commercial property customers, then pays claims when covered losses occur. The company is best known for its presence in Florida, but it also writes business in other states including the Northeast, Southeast, and Hawaii through a mix of agency distribution and selective underwriting.
Its business model depends on three main levers: pricing policies correctly, limiting exposure in the riskiest areas, and using reinsurance to protect itself from very large catastrophe losses. For an insurer like Heritage, profitability is not just about selling more policies. It also depends on claims trends, weather, litigation costs, and whether management can keep enough premium after paying for reinsurance.
Based on the company’s recent filings, revenue comes primarily from insurance operations, with a smaller contribution from investment income and other items.
- Gross premiums earned and related insurance revenue: approximately 90% to 95%. This is the core business and includes homeowners, dwelling fire, condominium, renters, and some commercial residential property coverage.
- Net investment income: approximately 3% to 7%. Like most insurers, Heritage invests its float, mainly in fixed-income securities and cash-like instruments.
- Other insurance-related and miscellaneous revenue: approximately 1% to 3%. This can include fee-based or ancillary items depending on the reporting period.
Within insurance operations, personal residential property remains the dominant source of premium, while commercial residential and other property lines are materially smaller. The company has also increasingly emphasized underwriting discipline and geographic diversification rather than pure volume growth.
A notable recent operating trend is the sharp improvement in profitability after the difficult 2021-2022 period. Revenue has climbed from roughly $630 million in 2021 to the mid-$800 million range by 2025, while net income moved from deep losses to strong profitability. That shows a business that has gone through a repair cycle rather than a steady straight-line expansion.
The financial flow illustrates that Heritage’s turnaround has been driven less by explosive top-line growth and more by a much better relationship between premiums collected, claims costs, and operating expenses. That matters because insurers create value when margins improve without taking excessive balance-sheet risk.
Key Figures
| Metric | Value | Sector ⓘ |
|---|---|---|
| Date | Oct 17, 2026 | |
| Context | ||
| Sector | Financial Services | |
| Industry | Insurance - Property & Casualty | |
| Market Cap ⓘ | $1.08B | |
| Beta ⓘ | 0.92 | |
Value (Cheapness) | ||
| P/E Ratio ⓘ | 5.16 | 12.26 |
| P/B Ratio ⓘ | 1.94 | 1.23 |
| FCF Yield ⓘ | 28.04% | 10.40% |
| Dividend Yield ⓘ | N/A | 3.02% |
| EBIT / EV ⓘ | 60.41% | 8.14% |
| PEG ⓘ | N/A | |
Growth (Business expansion) | ||
| Revenue Growth ⓘ | 3.00% | 9.35% |
| RPS Growth (5Y CAGR) ⓘ | 4.78% | 12.19% |
| EPS Growth (5Y CAGR) ⓘ | N/A | -9.53% |
| BVPS Growth (5Y CAGR) ⓘ | 7.25% | 4.99% |
| Margin Growth (5Y Trend) ⓘ | 42.31% | -3.86% |
| FCF Growth (5Y CAGR) ⓘ | 31.01% | 4.81% |
| DPS Growth (5Y CAGR) ⓘ | -70.87% | 8.79% |
Quality (Business durability) | ||
| ROIC (Latest) ⓘ | 37.75% | 9.49% |
| ROE (Latest) ⓘ | 42.84% | 13.90% |
| ROA (Latest) ⓘ | 8.95% | 1.55% |
| ROIC (5Y Median) ⓘ | 18.36% | 7.86% |
| ROE (5Y Median) ⓘ | 24.08% | 12.17% |
| ROA (5Y Median) ⓘ | 2.01% | 1.30% |
| Net Debt / EBIT (Latest) ⓘ | -1.68 | 0.96 |
| Net Debt / EBIT (5Y Median) ⓘ | -3.33 | 0.73 |
| Net Debt / EBITDA (Latest) ⓘ | -1.61 | 0.92 |
| Operating Margin (Latest) ⓘ | 37.67% | 22.30% |
| Operating Margin (5Y Median) ⓘ | 8.59% | 24.63% |
| Debt to Equity (Latest) ⓘ | 16.18% | 58.56% |
| Profit Margin (Latest) ⓘ | 25.19% | 26.57% |
| Free Cash Flow (Latest) ⓘ | $302.57M | |
Momentum (Price trend) | ||
| 3Y Return ⓘ | +626.39% | +88.33% |
| 12M Return (excl. last month) ⓘ | +44.38% | +19.38% |
| 6M Return ⓘ | +37.22% | +4.75% |
| Price vs. 200-Day MA ⓘ | +30.25% | +3.50% |
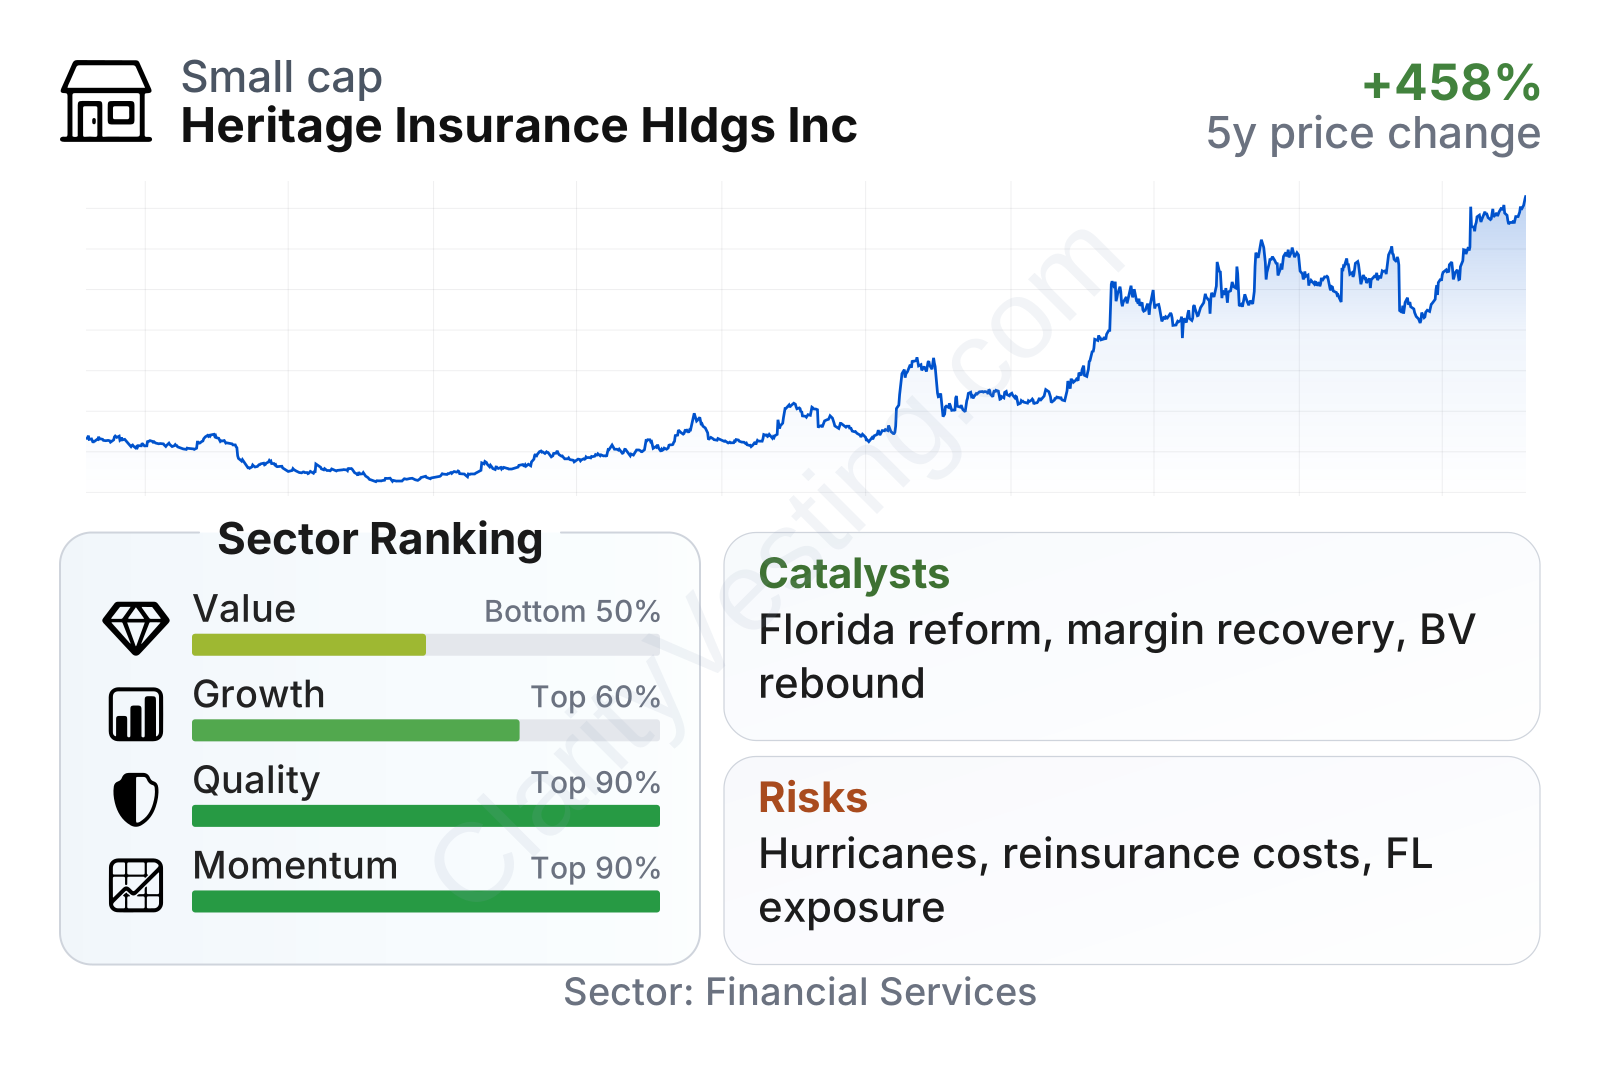
Heritage is now a mid-sized insurer with a stock that has staged a very strong recovery from 2022 lows. The latest metrics show an unusual mix: valuation measures based on earnings and cash flow look cheap relative to the sector, while the price-to-book multiple is no longer depressed. Quality metrics are particularly strong, with returns on equity and assets well above sector medians and low leverage for an insurer. Growth metrics are more mixed, reflecting a company that has improved margins dramatically but has not grown revenue as fast as many peers.
Growth
The property and casualty insurance sector is not a classic high-growth industry, but it can produce attractive long-term results when pricing conditions are favorable. Heritage operates in residential property insurance, where demand is persistent because homeowners typically need coverage regardless of the economic cycle. The challenge is that this is also a volatile segment, especially in catastrophe-prone states.
Heritage’s current strategy appears more focused than it was a few years ago. Management has been reshaping the book of business, tightening underwriting, reducing poorly performing exposure, seeking better rate adequacy, and expanding where returns look more attractive. That approach makes sense for future growth because the company does not need rapid policy count expansion to improve value; it needs disciplined premium growth with controlled loss experience.
A major catalyst for the business has been the improvement in Florida’s insurance environment after years of heavy claims pressure and legal-system distortion. Industry reforms aimed at reducing abusive litigation and assignment-of-benefits issues have helped many Florida-focused carriers stabilize results. If those reforms continue to work as intended, Heritage could benefit through lower claims friction, better reserve development, and more predictable underwriting margins.
The earnings trend highlights how dramatic the rebound has been. Heritage moved from losses in 2021 and 2022 to positive earnings in 2023 and 2024, then to a much stronger level in 2025. That kind of shift usually reflects a mix of rate increases, better risk selection, lower non-catastrophe loss pressure, and a more favorable expense structure. It is encouraging, but it also means comparisons are now tougher because the business is no longer recovering from a depressed base.
Book value per share also recovered strongly after the 2022 drawdown. For insurers, book value matters because it reflects the capital cushion supporting underwriting and growth. Heritage’s rebound here suggests that recent earnings were not just accounting noise; they rebuilt shareholder equity in a meaningful way. A stronger capital base can support additional premium writings, improve flexibility in reinsurance negotiations, and reduce pressure on external financing.
Another possible growth driver is reinsurance market normalization. If Heritage can secure protection at more favorable terms, it may retain more profitable business and keep a larger portion of underwriting gains. Recent company updates have also pointed to continued execution around portfolio optimization rather than aggressive expansion, which is a healthier foundation for long-term compounding in this industry.
Risks
This article is for informational purposes only and does not constitute financial advice. Some content is AI-generated. See Disclaimer


