Stock Analysis · HealthEquity Inc (HQY)
Overview
HealthEquity is a healthcare financial services company focused on helping people save, spend, and invest money for medical expenses. Its core business is built around tax-advantaged health accounts, especially Health Savings Accounts, or HSAs. Employers, health plans, benefits advisors, and health plan members use its platform to manage healthcare savings, pay medical bills, and invest unused balances.
The company became much larger after its acquisition of WageWorks, which expanded its reach into consumer-directed benefits such as flexible spending accounts and other reimbursement products. Today, HealthEquity operates as both a custodian of HSA assets and a technology-enabled administrator of healthcare spending and benefits accounts. That combination matters because it gives the company both recurring service revenue and asset-based revenue tied to the balances sitting in accounts.
Based on the company’s latest annual reporting, revenue is mainly generated from three broad sources.
- Service revenue: about 51% of revenue. This includes fees paid by employers, health plans, members, and partners for administering HSAs and other consumer-directed benefit accounts, as well as platform and account services.
- Custodial revenue: about 29% of revenue. This comes from cash held in HSA custodial accounts, including interest earned on deposits and fees tied to custodial services.
- Interchange revenue: about 20% of revenue. This is generated when members use HealthEquity payment cards for eligible healthcare spending.
The business mix is useful for long-term analysis because it is not dependent on only one lever. Account growth supports service fees, larger balances support custodial income, and more card usage supports interchange. Recent financial progress also shows a stronger conversion of revenue into operating profit than a few years ago, with revenue rising from under $0.8 billion in fiscal 2022 to over $1.3 billion in fiscal 2026 while net income moved from losses to meaningful profitability.
The business has become noticeably more efficient over the last several years. Revenue has grown steadily, gross profit has expanded faster than revenue, and operating income has improved from negative territory to a strong positive level, showing better scale and stronger margin discipline.
Key Figures
| Metric | Value | Sector ⓘ |
|---|---|---|
| Date | Oct 03, 2026 | |
| Context | ||
| Sector | Healthcare | |
| Industry | Health Information Services | |
| Market Cap ⓘ | $7.32B | |
| Beta ⓘ | 0.23 | |
Value (Cheapness) | ||
| P/E Ratio ⓘ | 31.93 | 24.06 |
| P/B Ratio ⓘ | 3.77 | 3.08 |
| FCF Yield ⓘ | 6.45% | 3.07% |
| Dividend Yield ⓘ | N/A | 2.05% |
| EBIT / EV ⓘ | 4.12% | 0.63% |
| PEG ⓘ | 1.32 | |
Growth (Business expansion) | ||
| Revenue Growth ⓘ | 7.60% | 7.50% |
| RPS Growth (5Y CAGR) ⓘ | 13.34% | 8.70% |
| EPS Growth (5Y CAGR) ⓘ | 13.62% | -18.20% |
| BVPS Growth (5Y CAGR) ⓘ | 1.97% | 3.95% |
| Margin Growth (5Y Trend) ⓘ | 30.00% | -0.58% |
| FCF Growth (5Y CAGR) ⓘ | 228.38% | 0.88% |
| DPS Growth (5Y CAGR) ⓘ | N/A | 6.80% |
Quality (Business durability) | ||
| ROIC (Latest) ⓘ | 8.54% | 3.29% |
| ROA (Latest) ⓘ | 7.09% | 3.02% |
| ROIC (5Y Median) ⓘ | 3.35% | 4.75% |
| ROA (5Y Median) ⓘ | 1.78% | 1.93% |
| Net Debt / EBIT (Latest) ⓘ | 2.12 | 1.33 |
| Net Debt / EBIT (5Y Median) ⓘ | 4.37 | 1.83 |
| Net Debt / EBITDA (Latest) ⓘ | 1.52 | 0.99 |
| Net Debt / Assets ⓘ | 21.86% | 5.33% |
| EBITDA / Interest ⓘ | 8.94 | 9.63 |
| Operating Margin (Latest) ⓘ | 24.77% | 9.25% |
| Operating Margin (5Y Median) ⓘ | 12.94% | 7.80% |
| Debt to Equity (Latest) ⓘ | 48.79% | 28.99% |
| Profit Margin (Latest) ⓘ | 17.36% | 3.60% |
| Free Cash Flow (Latest) ⓘ | $471.67M | |
Momentum (Price trend) | ||
| 3Y Return ⓘ | +21.10% | +37.48% |
| 12M Return (excl. last month) ⓘ | +8.59% | +20.85% |
| 6M Return ⓘ | +7.18% | +9.73% |
| Price vs. 200-Day MA ⓘ | +0.73% | +4.69% |
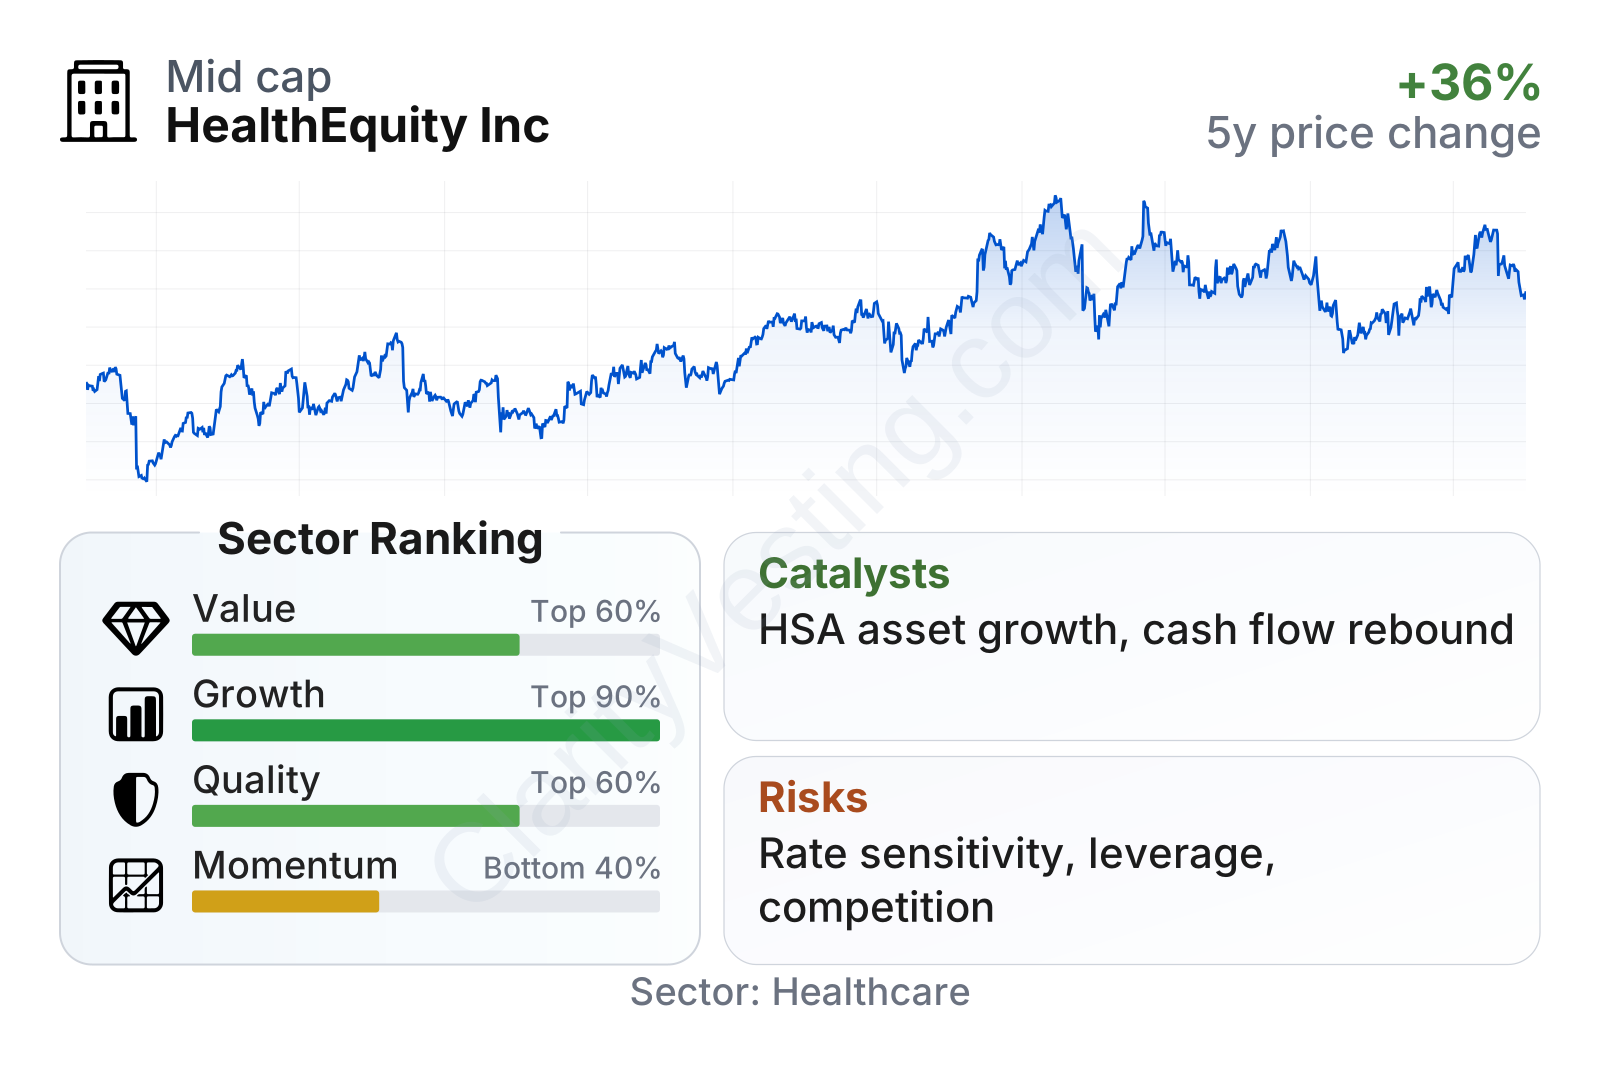
HealthEquity sits in the large mid-cap range and has shown relatively low share-price volatility, with a beta far below 1. The overall profile is mixed but improving: growth metrics are among the strongest in its sector, profitability is clearly above sector norms, and cash generation has become more meaningful. Valuation is not cheap on traditional earnings and book value multiples, but cash-flow-based measures look stronger than the sector median. Share-price momentum has been weaker than much of the healthcare group, which helps explain why the stock’s multiple has fallen well below its own recent highs.
The stock history also shows that sentiment can swing sharply. The shares have experienced several drawdowns, but the longer pattern since 2023 has been one of recovery rather than a collapsing business. That distinction matters for long-term analysis because the operating trend has improved more consistently than the trading pattern.
Growth
HealthEquity operates in a part of healthcare finance that still has room to expand. HSAs remain tied to the broader adoption of high-deductible health plans in the United States, and the long-term industry logic is straightforward: as medical costs stay high, individuals and employers keep looking for more structured ways to save and pay for care. That creates a supportive backdrop for account administrators with scale, compliance capabilities, and established distribution partnerships.
The company’s strategy also makes sense in that context. It is not only trying to gather more accounts; it is also trying to deepen economics per account through custodial balances, payments activity, and investment adoption. Once an employer, health plan, or member is on the platform, there are multiple ways for HealthEquity to monetize that relationship over time. This creates a compounding effect if account counts, average balances, and spending activity all move in the right direction.
Revenue growth has slowed from the very strong post-acquisition and post-recovery periods, but it has remained positive and recently stayed in the high-single-digit range. That is slower than the peaks seen in earlier years, yet still supportive of a business that is growing rather than stalling. Over five years, revenue per share growth and earnings growth have both run ahead of the healthcare sector median, which suggests the business has been adding scale without simply diluting shareholders.
Free cash flow has been volatile, including a negative period in fiscal 2025, but the latest level shows a major rebound to well over $400 million. That recovery is important because it suggests the company’s earnings improvement is increasingly being reflected in actual cash generation. If sustained, that gives HealthEquity more flexibility to reduce debt, invest in technology, or pursue additional product development.
A meaningful catalyst is the company’s position as one of the largest dedicated HSA custodians and administrators in the market. Scale helps attract health plan partners and employers, and it can improve operating leverage as more accounts are added to the same infrastructure. Another favorable factor is interest income sensitivity: when HSA cash balances are large, custodial revenue can remain a meaningful earnings support. Recent company communications have also emphasized ongoing account growth, funded HSA growth, and expanding assets under custody, all of which reinforce the underlying business momentum.
Risks
This article is for informational purposes only and does not constitute financial advice. Some content is AI-generated. See Disclaimer


