Stock Analysis · Hornbeck Offshore Services Inc (HOS)
Overview
Hornbeck Offshore Services is a U.S. marine transportation company focused on the offshore energy industry. It operates a fleet of high-specification vessels that support offshore oil and gas exploration, development, and production, mainly in the Gulf of America/Gulf of Mexico and selected international markets. In practical terms, the company moves people, equipment, and supplies to offshore platforms and drilling sites, and it also provides specialized marine services for more complex offshore work.
The business is centered on offshore support vessels, with revenue mainly coming from vessel day rates and related marine services. Based on the company’s reporting structure and vessel mix, the main sources of revenue are approximately:
- Offshore Supply Vessels (OSVs): about 70% to 80% — These vessels transport cargo, drilling materials, fluids, tools, and personnel to offshore facilities. This is the company’s core business.
- Multi-Purpose Support Vessels (MPSVs): about 20% to 30% — These larger and more specialized vessels support subsea construction, remotely operated vehicle work, inspection, maintenance, repair, and accommodation-related tasks.
- Other marine and ancillary revenue: typically a small remainder — This can include vessel management, charter-related pass-through items, and service reimbursements depending on the period.
Hornbeck’s positioning is more specialized than that of a broad shipping company. It is tied much more directly to offshore activity levels, especially deepwater work, where customers need modern vessels with strong technical capabilities rather than basic commodity shipping capacity.
The business mix shown over the last few years points to rising revenue and improving profit conversion. Revenue expanded from roughly $450 million in 2022 to about $640 million in 2024, while interest expense moved down materially, helping net income recover even though operating costs also climbed.
Key Figures
| Metric | Value | Sector ⓘ |
|---|---|---|
| Date | Oct 24, 2026 | |
| Context | ||
| Sector | Industrials | |
| Industry | Marine Shipping | |
| Market Cap ⓘ | $2.18B | |
| Beta ⓘ | N/A | |
Value (Cheapness) | ||
| P/E Ratio ⓘ | 15.86 | 22.29 |
| P/B Ratio ⓘ | N/A | 1.98 |
| FCF Yield ⓘ | N/A | 6.26% |
| Dividend Yield ⓘ | N/A | 1.92% |
| EBIT / EV ⓘ | N/A | 4.83% |
| PEG ⓘ | N/A | |
Growth (Business expansion) | ||
| Revenue Growth ⓘ | -11.30% | 9.30% |
| RPS Growth (5Y CAGR) ⓘ | N/A | 7.76% |
| EPS Growth (5Y CAGR) ⓘ | N/A | -13.17% |
| BVPS Growth (5Y CAGR) ⓘ | N/A | 6.13% |
| Margin Growth (5Y Trend) ⓘ | -8.04% | 0.74% |
| FCF Growth (5Y CAGR) ⓘ | N/A | 10.79% |
| DPS Growth (5Y CAGR) ⓘ | N/A | 9.41% |
Quality (Business durability) | ||
| ROIC (Latest) ⓘ | N/A | 10.75% |
| ROA (Latest) ⓘ | N/A | 5.41% |
| ROIC (5Y Median) ⓘ | N/A | 9.37% |
| ROA (5Y Median) ⓘ | N/A | 4.95% |
| Net Debt / EBIT (Latest) ⓘ | N/A | 2.04 |
| Net Debt / EBIT (5Y Median) ⓘ | N/A | 2.27 |
| Net Debt / EBITDA (Latest) ⓘ | N/A | 1.39 |
| Net Debt / Assets ⓘ | 29.48% | 19.27% |
| EBITDA / Interest ⓘ | N/A | 9.58 |
| Operating Margin (Latest) ⓘ | N/A | 10.49% |
| Operating Margin (5Y Median) ⓘ | 22.82% | 10.30% |
| Debt to Equity (Latest) ⓘ | N/A | 64.82% |
| Profit Margin (Latest) ⓘ | 17.67% | 6.67% |
| Free Cash Flow (Latest) ⓘ | N/A | |
Momentum (Price trend) | ||
| 3Y Return ⓘ | -35.45% | +67.77% |
| 12M Return (excl. last month) ⓘ | +33.92% | +12.05% |
| 6M Return ⓘ | -28.57% | 0.00% |
| Price vs. 200-Day MA ⓘ | -25.95% | +0.67% |
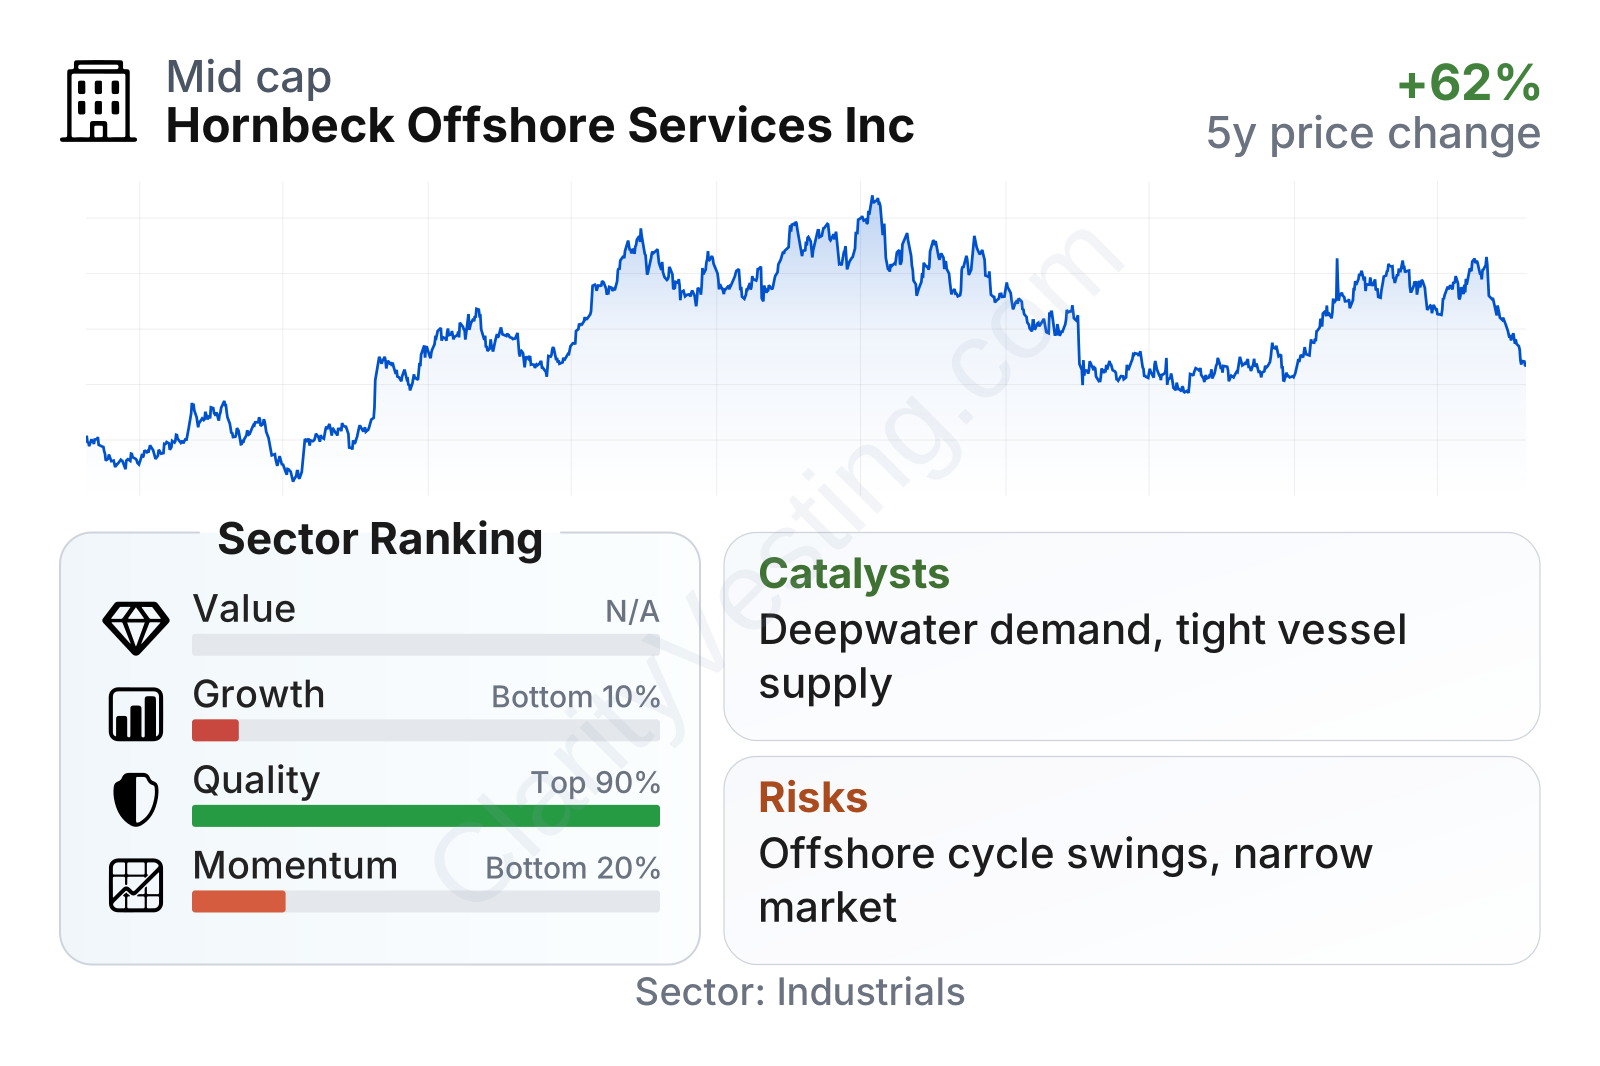
The overall picture is mixed. On one hand, profitability and operating quality look strong relative to much of the industrial universe: profit margin is well above the sector median, long-term operating margins have been unusually healthy, and leverage appears manageable by debt-to-equity standards. On the other hand, growth metrics are weak right now, ranking near the bottom of the sector, with recent revenue down year over year and margin trends softer than the broader peer group. Market behavior also reflects that tension: the shares have rebounded sharply over the past year before the most recent month, but the longer three-year record and recent six-month trend remain volatile and below broader sector performance.
The stock’s history also shows why Hornbeck is best understood as a cyclical company. The share price climbed strongly from 2022 into 2024, then gave back a meaningful portion of those gains before recovering again in 2026. That pattern usually signals that the market is reassessing offshore energy demand, vessel utilization, and day-rate durability rather than treating the company like a steady compounder.
Growth
Hornbeck operates in a sector that can grow, but not in a smooth or predictable way. Offshore energy services benefit when oil companies commit capital to deepwater production, maintenance, and subsea work. Those projects are typically large, long-lived, and less sensitive to short-term price swings than some shale activity, which can support multi-year demand for marine assets once project cycles are underway. That gives Hornbeck exposure to a potentially durable niche within energy services.
The company’s strategy broadly makes sense for that niche. Hornbeck is focused on high-specification vessels rather than low-end marine capacity, which matters because customers working in deepwater environments care about reliability, technical capability, and safety credentials. This can support better day rates and stronger vessel utilization than older or less capable fleets. The company has also benefited from lower interest expense in recent years, which improves the earnings impact of any revenue growth that does come through.
A meaningful catalyst is the continued need for offshore production support in the U.S. Gulf and other deepwater markets. Major offshore fields require regular logistics, inspection, maintenance, and subsea intervention work even after initial development. If offshore capital spending remains stable or improves, Hornbeck’s specialized fleet can capture more utilization and pricing power. Another catalyst is the limited supply of modern vessels across parts of the offshore support market; when demand strengthens, tight vessel availability can improve contract economics relatively quickly.
Recent operating history supports that opportunity in part. Revenue increased materially from 2022 through 2024, and net income also improved over that period. Even though the latest growth profile has turned negative on a year-over-year basis, the broader trend still shows a business that has already participated in an offshore recovery rather than one starting from zero.
Risks
This article is for informational purposes only and does not constitute financial advice. Some content is AI-generated. See Disclaimer


