Stock Analysis · Robinhood Markets Inc (HOOD)
Overview
Robinhood Markets is a digital financial platform built around a mobile-first app. It started as a low-cost stock trading service, but it now offers a wider set of products including brokerage accounts, options, margin lending, cash management, retirement accounts, and crypto trading. The company’s core idea is to make investing and personal finance easier to access for individuals, especially younger users who are comfortable managing money on a smartphone.
Its business model is different from a traditional bank or a full-service brokerage. Robinhood does not rely mainly on advisory fees. Instead, it earns money from customer trading activity, interest-related income, subscriptions, and services tied to customer balances and cash usage. That means revenue can shift depending on market activity, interest rates, and crypto demand.
Based on recent annual disclosures, Robinhood’s main sources of revenue are approximately the following, from largest to smallest:
- Net interest revenues: about 50% to 55% — mainly interest earned on segregated cash, margin loans, securities lending, and interest-generating assets, minus interest expenses.
- Transaction-based revenues: about 35% to 40% — revenue linked to trading activity in options, equities, and cryptocurrencies, including order-routing economics and related trading income.
- Other revenues: about 8% to 12% — mostly Robinhood Gold subscriptions and smaller service-related items.
Within transaction-based revenue, options have generally been the largest category, while crypto can swing sharply from one period to another depending on market sentiment and trading volumes. This mix matters for long-term analysis because it shows that Robinhood is no longer only a trading app: it is becoming more dependent on recurring balance-based income, which is usually more stable than purely transaction-driven revenue.
The financial flow over the last few years also shows a major shift. Revenue fell after the 2021 boom, then recovered strongly, while expenses became much more controlled. The result is a clear move from heavy losses to meaningful profitability, helped by stronger gross profit and much better operating discipline.
Key Figures
| Metric | Value | Sector ⓘ |
|---|---|---|
| Date | Nov 21, 2026 | |
| Context | ||
| Sector | Financial Services | |
| Industry | Capital Markets | |
| Market Cap ⓘ | $62.29B | |
| Beta ⓘ | 2.53 | |
Value (Cheapness) | ||
| P/E Ratio ⓘ | 31.88 | 12.01 |
| P/B Ratio ⓘ | 6.30 | 1.48 |
| FCF Yield ⓘ | 4.77% | 8.77% |
| Dividend Yield ⓘ | N/A | 3.01% |
| EBIT / EV ⓘ | 3.30% | 8.31% |
| PEG ⓘ | 1.12 | |
Growth (Business expansion) | ||
| Revenue Growth ⓘ | 11.80% | 6.70% |
| RPS Growth (5Y CAGR) ⓘ | 23.38% | 12.35% |
| EPS Growth (5Y CAGR) ⓘ | N/A | -0.27% |
| BVPS Growth (5Y CAGR) ⓘ | 4.16% | 4.83% |
| Margin Growth (5Y Trend) ⓘ | N/A | -4.16% |
| FCF Growth (5Y CAGR) ⓘ | N/A | 4.69% |
| DPS Growth (5Y CAGR) ⓘ | N/A | 8.82% |
Quality (Business durability) | ||
| ROIC (Latest) ⓘ | 7.00% | 9.49% |
| ROE (Latest) ⓘ | 20.83% | 14.02% |
| ROA (Latest) ⓘ | 4.12% | 1.53% |
| ROIC (5Y Median) ⓘ | -4.39% | 7.80% |
| ROE (5Y Median) ⓘ | -7.93% | 12.09% |
| ROA (5Y Median) ⓘ | -2.64% | 1.28% |
| Net Debt / EBIT (Latest) ⓘ | 7.19 | 0.88 |
| Net Debt / EBIT (5Y Median) ⓘ | N/A | 0.73 |
| Net Debt / EBITDA (Latest) ⓘ | 6.90 | 0.71 |
| Operating Margin (Latest) ⓘ | 44.56% | 23.37% |
| Operating Margin (5Y Median) ⓘ | -28.74% | 24.29% |
| Debt to Equity (Latest) ⓘ | 221.38% | 59.34% |
| Profit Margin (Latest) ⓘ | 39.04% | 26.65% |
| Free Cash Flow (Latest) ⓘ | $2.97B | |
Momentum (Price trend) | ||
| 3Y Return ⓘ | +664.70% | +73.29% |
| 12M Return (excl. last month) ⓘ | -22.69% | +18.35% |
| 6M Return ⓘ | -18.11% | +3.24% |
| Price vs. 200-Day MA ⓘ | -31.66% | +2.17% |
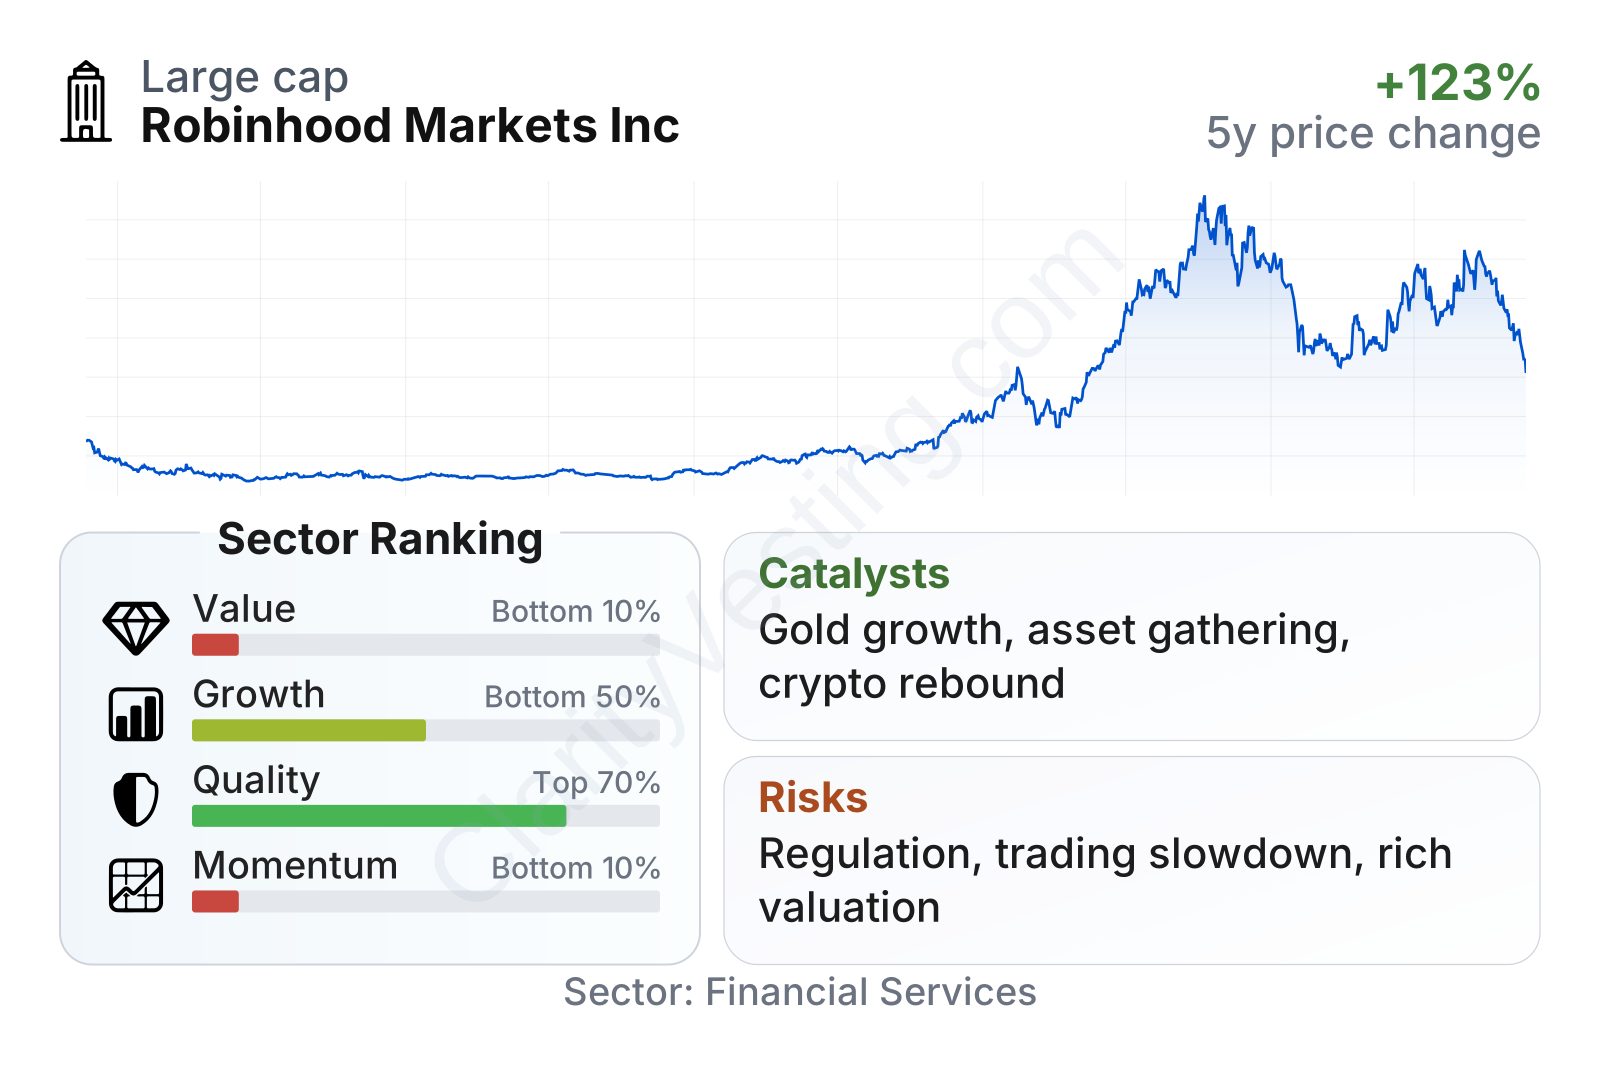
Robinhood is now a large company by market value, but it remains a volatile stock, with a beta well above 2. Its share price history shows just how unstable sentiment can be: after collapsing from post-IPO highs, the stock rebounded dramatically over the last two years. That kind of move usually means the market is pricing in both strong upside potential and meaningful uncertainty.
The overall metric profile is mixed. Growth remains better than the sector median in several important areas, especially over a multi-year revenue-per-share view, while current quality metrics are stronger than many peers. Profitability and returns on capital have improved sharply, and free cash flow is solidly positive. On the other hand, valuation multiples are far above sector norms, and the stock’s recent momentum is weaker than its longer-term performance would suggest. In simple terms, the business has improved faster than its reputation from the loss-making years, but the market is no longer valuing it like a turnaround at a discount.
Growth
Robinhood operates in a part of financial services that still has room to expand. Retail investing, self-directed savings, digital wallets, and app-based financial products continue to gain users over time, especially among younger households. That broader shift favors companies that can combine investing, spending, cash management, and retirement tools inside one simple interface.
Robinhood’s strategy for future growth is fairly logical. It is trying to deepen customer relationships rather than depend only on bursts of trading activity. That includes gathering more customer assets, increasing paid subscriptions through Robinhood Gold, growing retirement accounts, expanding lending and cash products, and broadening international or crypto-related offerings where regulation allows. For a long-term view, this matters because asset gathering and recurring services tend to be more durable than meme-stock trading waves.
The earnings trend shows how significant the turnaround has been. Robinhood moved from deep losses in 2021 and 2022 to positive earnings in 2023, then materially higher profitability in 2024 and 2025. That pattern suggests the company is no longer just promising scale; it has already shown that scale can translate into earnings.
Book value per share also recovered after earlier pressure. The increase since 2023 indicates that profitability is beginning to rebuild shareholder equity. This is not explosive growth, but it supports the idea that Robinhood’s improvement is backed by actual balance-sheet progress rather than only market excitement.
A strong catalyst is Robinhood’s ability to monetize customer balances more effectively. Higher assets under custody, more margin usage, stronger adoption of premium subscriptions, and broader product usage can all lift revenue without requiring the same level of customer acquisition spending seen in earlier years. Another catalyst is the company’s growing position in active trader segments, where options and crypto engagement can drive large revenue increases when market activity rises.
Recent company updates have also highlighted continued product expansion, including efforts around active trading tools, wealth-building features, and international or token-related initiatives. The significance is less about any single launch and more about direction: Robinhood is trying to become a broader consumer financial platform, not just an entry-level brokerage app. If that transition continues, the revenue base could become more diversified and more resilient.
Risks
This article is for informational purposes only and does not constitute financial advice. Some content is AI-generated. See Disclaimer