Stock Analysis · Honeywell Aerospace Inc (HONA)
Overview
Honeywell Aerospace Inc is a large aerospace and defense company focused on aircraft systems, engines, avionics, auxiliary power units, maintenance services, connected software, and defense-related technologies. In simple terms, it helps commercial airlines, business jet operators, aircraft manufacturers, and military customers build, operate, maintain, and upgrade aircraft. Its products are often deeply embedded in the aircraft, which can create long relationships with customers because equipment usually needs certification, ongoing servicing, spare parts, and software support over many years.
The business model is typically split between original equipment sold for new aircraft and aftermarket revenue generated once planes are in service. That second stream is especially important in aerospace because fleets remain active for decades, creating recurring demand for repairs, parts, and upgrades. Honeywell Aerospace also benefits from exposure to both civil aviation and defense, which can soften the impact of weakness in one end market when the other remains solid.
Based on the company’s public reporting structure and industry disclosures, the main revenue sources are broadly the following:
- Commercial aerospace original equipment and systems: flight decks, navigation and communication systems, engines, APUs, wheels and brakes, environmental controls, and other onboard equipment for airliners and business jets.
- Commercial aftermarket services and spare parts: maintenance, repair, overhauls, replacement parts, software updates, and connected services tied to installed equipment. In many aerospace companies, this is a very meaningful share of revenue and often carries stronger margins than original equipment.
- Defense and space: avionics, propulsion-related systems, logistics, and mission systems supplied to military aircraft, helicopters, transport platforms, and defense programs.
- Warehouse automation and productivity solutions: this has historically included scanning, mobility, warehouse execution, and automation offerings when presented within the broader Honeywell group structure, though investors need to watch how segment definitions evolve after portfolio changes.
- Building technologies and industrial automation exposure: depending on the reporting perimeter used in current filings, some historic revenue context may still reflect ties to the broader Honeywell corporate structure before separation.
Recent financial flow trends show a business that has continued to expand revenue over the last three reported years, but with rising costs and notably heavier interest expense in the latest year. Gross profit has still grown, which suggests the core operations remain healthy, yet a larger share of revenue is being absorbed by operating and financing costs than before. That matters because long-term returns depend not just on sales growth, but on how much of those sales ultimately become cash and earnings.
Key Figures
| Metric | Value | Sector ⓘ |
|---|---|---|
| Date | Oct 24, 2026 | |
| Context | ||
| Sector | Industrials | |
| Industry | Aerospace & Defense | |
| Market Cap ⓘ | $50.68B | |
| Beta ⓘ | N/A | |
Value (Cheapness) | ||
| P/E Ratio ⓘ | 48.75 | 22.29 |
| P/B Ratio ⓘ | N/A | 1.98 |
| FCF Yield ⓘ | 1.73% | 6.26% |
| Dividend Yield ⓘ | N/A | 1.92% |
| EBIT / EV ⓘ | 5.05% | 4.83% |
| PEG ⓘ | 1.04 | |
Growth (Business expansion) | ||
| Revenue Growth ⓘ | 5.40% | 9.30% |
| RPS Growth (5Y CAGR) ⓘ | 12.33% | 7.76% |
| EPS Growth (5Y CAGR) ⓘ | N/A | -13.17% |
| BVPS Growth (5Y CAGR) ⓘ | N/A | 6.13% |
| Margin Growth (5Y Trend) ⓘ | -7.61% | 0.74% |
| FCF Growth (5Y CAGR) ⓘ | 11.01% | 10.79% |
| DPS Growth (5Y CAGR) ⓘ | N/A | 9.41% |
Quality (Business durability) | ||
| ROIC (Latest) ⓘ | N/A | 10.75% |
| ROA (Latest) ⓘ | N/A | 5.41% |
| ROIC (5Y Median) ⓘ | N/A | 9.37% |
| ROA (5Y Median) ⓘ | N/A | 4.95% |
| Net Debt / EBIT (Latest) ⓘ | 4.41 | 2.04 |
| Net Debt / EBIT (5Y Median) ⓘ | N/A | 2.27 |
| Net Debt / EBITDA (Latest) ⓘ | 3.90 | 1.39 |
| Net Debt / Assets ⓘ | 76.55% | 19.27% |
| EBITDA / Interest ⓘ | 9.44 | 9.58 |
| Operating Margin (Latest) ⓘ | 19.49% | 10.49% |
| Operating Margin (5Y Median) ⓘ | 22.72% | 10.30% |
| Debt to Equity (Latest) ⓘ | -278.85% | 64.82% |
| Profit Margin (Latest) ⓘ | 10.86% | 6.67% |
| Free Cash Flow (Latest) ⓘ | $877.00M | |
Momentum (Price trend) | ||
| 3Y Return ⓘ | N/A | +67.77% |
| 12M Return (excl. last month) ⓘ | N/A | +12.05% |
| 6M Return ⓘ | N/A | 0.00% |
| Price vs. 200-Day MA ⓘ | N/A | +0.67% |
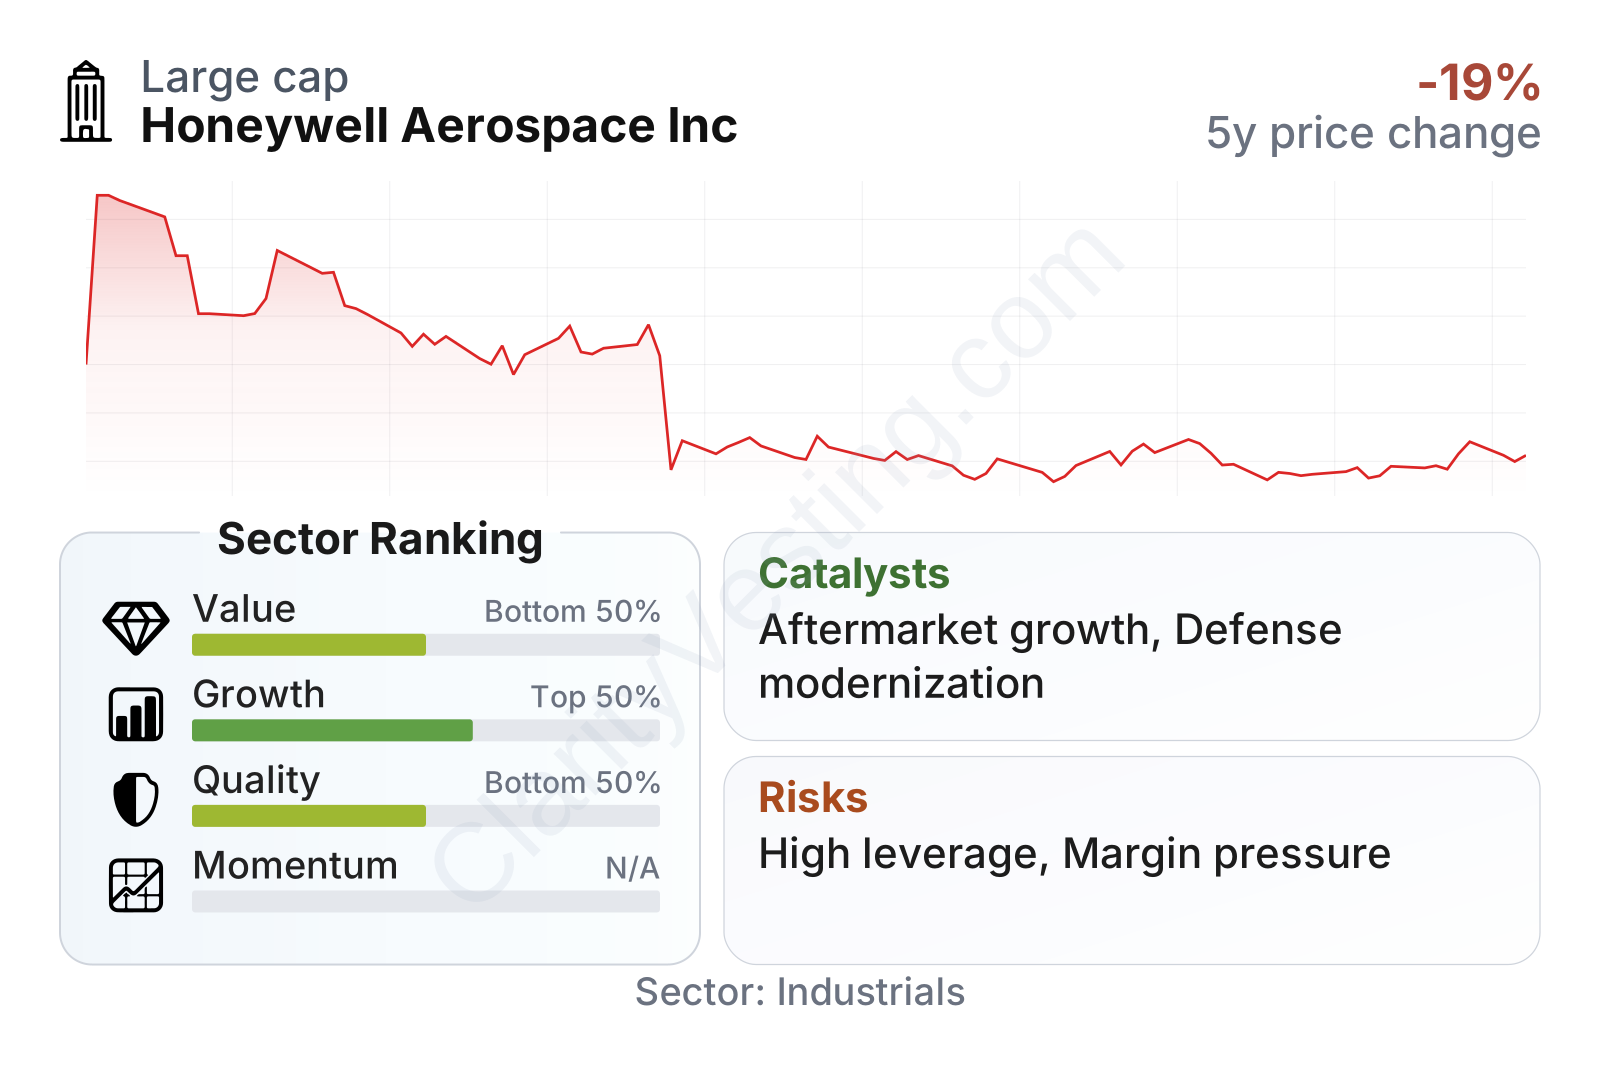
The company is large by industry standards, but the current profile is mixed. Growth metrics are generally better than the sector median over a five-year view, while value and balance-sheet quality metrics are less favorable. Revenue has still been advancing, free cash flow has grown over time, and operating margins remain well above the sector median. At the same time, leverage is elevated, free cash flow yield is relatively low, and the earnings multiple is far above the sector midpoint, which means the market is pricing in resilience and future progress rather than current cheapness.
The recent share-price move has been weak, with the stock down materially from mid-2026 levels shown in the chart. That decline can mean expectations have already cooled, but it also reflects pressure from concerns around debt, profitability trends, or execution. In other words, the market has become less willing to pay a premium without clearer evidence that earnings quality and balance-sheet strength are improving.
Growth
Honeywell Aerospace operates in a sector with several durable long-term drivers. Global air traffic has historically expanded over time, aircraft fleets age and require more maintenance, airlines continue to invest in fuel efficiency and reliability, and defense budgets in many countries remain focused on avionics, mission systems, and modernization. Those forces generally support multi-year demand for parts, upgrades, software, and integrated systems.
The company’s strategy also makes sense for long-duration growth because aerospace tends to reward installed base, certification know-how, and aftermarket reach. Once a system is selected for an aircraft platform, the supplier can benefit from production revenue for years and then service revenue long after delivery. That creates a more durable business model than one-off industrial equipment sales. Honeywell Aerospace is particularly well positioned where hardware, software, and maintenance are linked together, such as connected avionics, flight efficiency tools, cockpit systems, and support contracts.
A strong catalyst is the continued recovery and normalization of flight activity, especially in commercial aerospace and business aviation. More flying hours usually translate into more spare-parts demand and maintenance events. Another catalyst is defense modernization, where mission-critical electronics and systems integration are areas with long procurement cycles and relatively high barriers to entry. If the company can convert these trends into higher-margin aftermarket and service revenue, that would be more important than simple top-line expansion.
The financial profile also shows that revenue has climbed steadily from 2023 through 2025. However, margin pressure has appeared despite that growth, so the next phase matters: the company needs growth that translates into cleaner earnings and stronger cash generation, not just bigger sales. That is especially relevant in aerospace, where supply-chain friction, labor constraints, and program timing can distort results for several quarters.
Risks
This article is for informational purposes only and does not constitute financial advice. Some content is AI-generated. See Disclaimer