Stock Analysis · Hong Kong Land Holdings Ltd (HNGKY)
Overview
Hongkong Land Holdings is a large Asian property company focused on owning, developing, and managing premium real estate. Its best-known assets are prime office and retail properties in Hong Kong’s Central district, where it has a long-established presence. Beyond Hong Kong, the group also develops and invests in mixed-use, residential, office, and retail projects across Singapore, mainland China, and several Southeast Asian markets.
The business model has two main pillars. The first is investment properties, which means the company owns buildings and collects recurring rental income while also benefiting or suffering from changes in property values. The second is development properties, where it builds or partners on projects and recognizes profit when units are sold or projects are completed. This makes results more cyclical than a pure landlord model because development earnings can move sharply from year to year.
Based on recent annual disclosures, revenue is mainly split between rental and related property investment income on one side, and property development sales on the other. The exact mix can move meaningfully each year depending on project completions, but the rough picture is:
- Property investment and leasing: about 55% to 65% of revenue in a typical year. This includes office rent, luxury and premium retail rent, serviced apartments, and related property management income, with Hong Kong Central as the core contributor.
- Property development: about 35% to 45% of revenue, though this can be much more volatile from year to year. This includes residential and mixed-use project sales in Singapore, mainland China, and Southeast Asia, often through joint ventures and associates.
What matters most for long-term analysis is that the company combines a high-quality base of recurring rent with a more cyclical development arm. That mix can create strong asset backing and cash generation over time, but it also means accounting earnings can swing widely when property values are remeasured.
The operating picture has been uneven in recent years. Revenue has drifted lower from 2021 through 2025, while net income moved from losses to a strong rebound, which suggests the headline profit line has been heavily influenced by property valuation movements rather than by a steady rise in underlying sales. Interest costs have stayed material, which is normal for real estate, but they remain important to monitor.
Key Figures
| Metric | Value | Sector ⓘ |
|---|---|---|
| Date | Oct 24, 2026 | |
| Context | ||
| Sector | Real Estate | |
| Industry | Real Estate - Development | |
| Market Cap ⓘ | $17.68B | |
| Beta ⓘ | 0.40 | |
Value (Cheapness) | ||
| P/E Ratio ⓘ | 7.82 | 17.85 |
| P/B Ratio ⓘ | 0.56 | 0.87 |
| FCF Yield ⓘ | 4.99% | 7.30% |
| Dividend Yield ⓘ | 3.25% | 4.83% |
| EBIT / EV ⓘ | 11.15% | 3.78% |
| PEG ⓘ | 1.84 | |
Growth (Business expansion) | ||
| Revenue Growth ⓘ | -15.80% | 5.35% |
| RPS Growth (5Y CAGR) ⓘ | -9.76% | 6.02% |
| EPS Growth (5Y CAGR) ⓘ | N/A | -10.65% |
| BVPS Growth (5Y CAGR) ⓘ | -1.39% | 0.43% |
| Margin Growth (5Y Trend) ⓘ | 73.32% | -0.69% |
| FCF Growth (5Y CAGR) ⓘ | -0.47% | 5.40% |
| DPS Growth (5Y CAGR) ⓘ | 1.21% | 5.07% |
Quality (Business durability) | ||
| ROIC (Latest) ⓘ | N/A | 5.69% |
| ROE (Latest) ⓘ | N/A | 7.37% |
| ROA (Latest) ⓘ | N/A | 2.85% |
| ROIC (5Y Median) ⓘ | 1.51% | 4.26% |
| ROE (5Y Median) ⓘ | -0.99% | 6.04% |
| ROA (5Y Median) ⓘ | -0.79% | 2.45% |
| Net Debt / EBIT (Latest) ⓘ | 1.43 | 7.55 |
| Net Debt / EBIT (5Y Median) ⓘ | 6.25 | 8.26 |
| Net Debt / EBITDA (Latest) ⓘ | 1.41 | 5.26 |
| Net Debt / Assets ⓘ | 8.39% | 37.45% |
| EBITDA / Interest ⓘ | N/A | 4.11 |
| Operating Margin (Latest) ⓘ | 72.05% | 33.86% |
| Operating Margin (5Y Median) ⓘ | 38.07% | 37.49% |
| Debt to Equity (Latest) ⓘ | 19.35% | 88.76% |
| Profit Margin (Latest) ⓘ | 173.11% | 18.94% |
| Free Cash Flow (Latest) ⓘ | $881.95M | |
Momentum (Price trend) | ||
| 3Y Return ⓘ | +191.20% | +36.33% |
| 12M Return (excl. last month) ⓘ | +36.91% | +4.32% |
| 6M Return ⓘ | +3.75% | -1.74% |
| Price vs. 200-Day MA ⓘ | +2.64% | -1.42% |
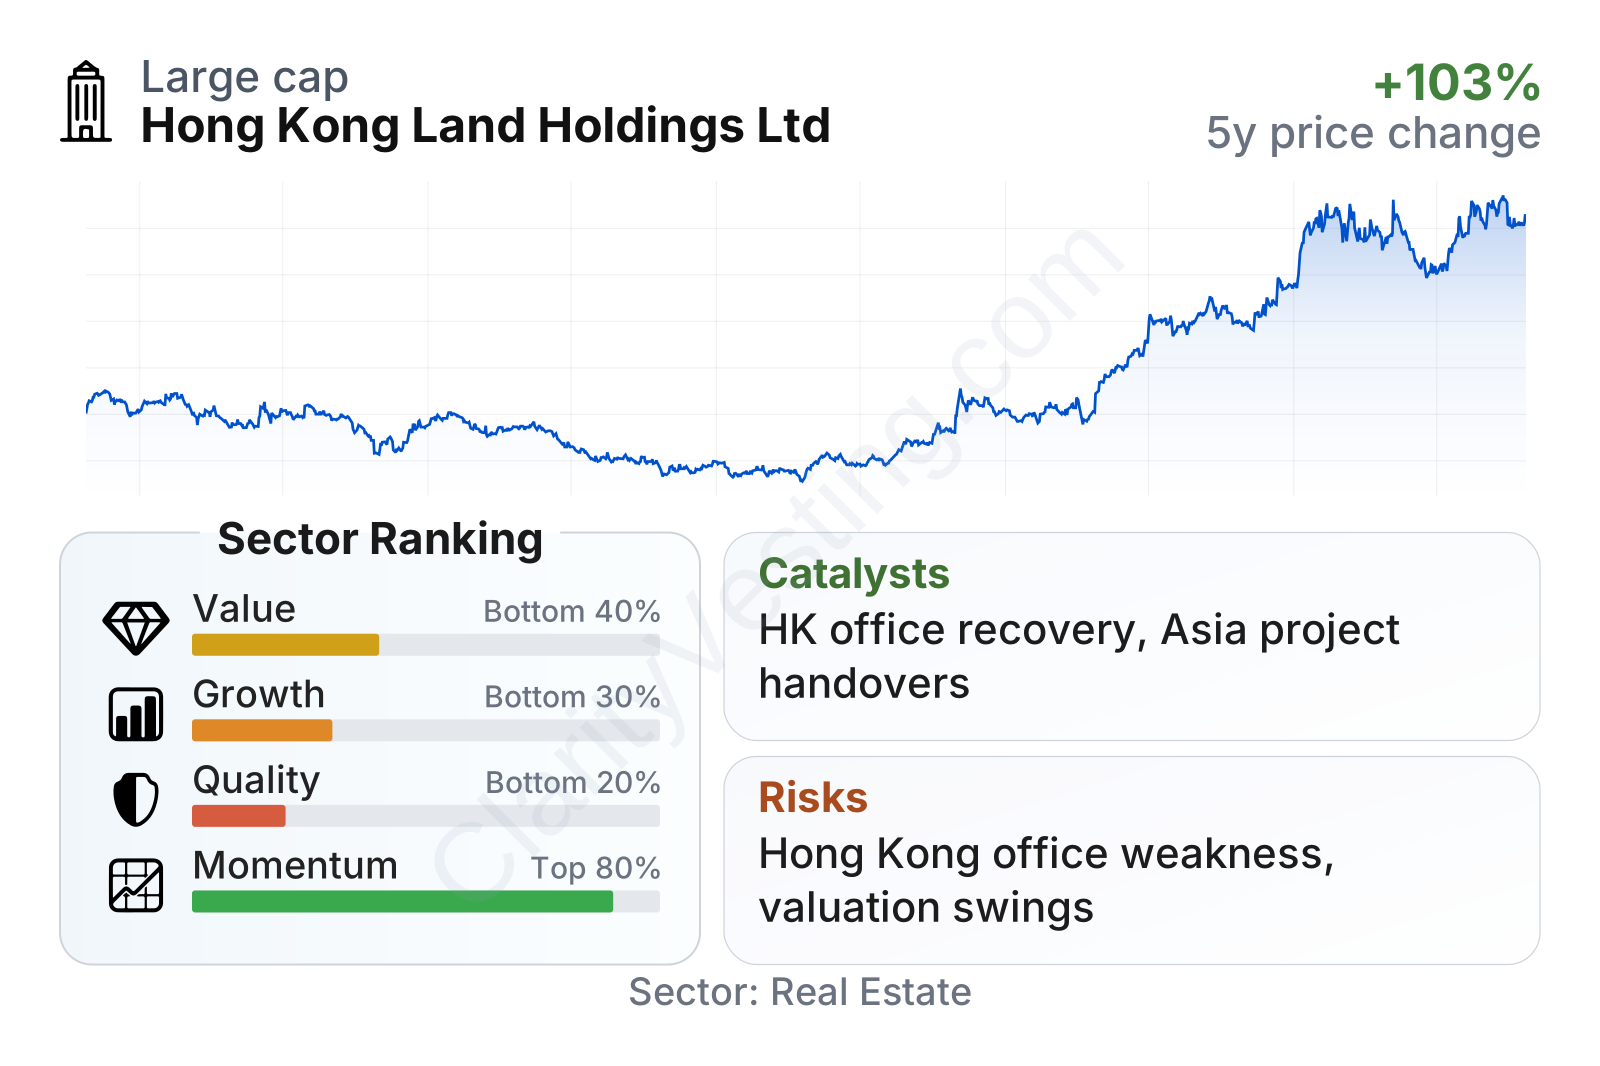
Hongkong Land stands out as a large real estate company with unusually low share-price volatility, shown by a beta well below 1. On valuation, the shares screen cheaply on earnings and book value versus the sector median, although free cash flow yield and dividend yield are not especially high for the industry. Growth and quality rankings are weaker than most peers, reflecting falling revenue over recent years and subdued return measures. At the same time, balance-sheet leverage looks more conservative than the sector, and recent share-price momentum has been notably stronger than most real estate stocks.
The stock-price history shows a sharp re-rating since mid-2025 after a long decline from 2021 to early 2024. That kind of move often means part of the valuation gap has already narrowed, even if some discount to underlying assets still appears to remain.
Growth
Hongkong Land operates in a sector that is mature rather than fast-growing. Prime office and retail ownership in central Hong Kong is not a high-growth market, and development profits across Asia depend on economic cycles, financing conditions, and buyer demand. So the growth case is less about rapid expansion and more about recovery, redevelopment, disciplined capital allocation, and unlocking value from premium assets.
The company’s strategy still has a clear logic for the future. Premium mixed-use districts in dense Asian cities tend to retain strategic value over long periods because land is scarce and high-end tenants often prefer central, prestigious locations. The group also has a diversified regional development pipeline outside Hong Kong, which gives it exposure to faster-growing urban markets than Hong Kong alone.
Revenue per share has trended down over the last five years, with only a brief rebound before falling again. That confirms the company has not recently been delivering consistent top-line expansion. For a real estate business, this means future progress likely depends more on leasing recovery, project completions, and better pricing conditions than on a simple volume growth narrative.
The dividend per share has been relatively steady, with only modest growth over five years. That stability suggests management has tried to preserve shareholder distributions through a volatile property cycle, although the pace of dividend growth has been limited. For a long-term assessment, this points to resilience rather than strong income growth.
A key catalyst is any sustained improvement in Hong Kong commercial property sentiment. If office demand stabilizes and high-end retail activity remains firm, recurring income from the company’s flagship portfolio could become more valuable. Another potential support is progress in regional development projects, especially where project handovers convert land investment into cash and reported profit. The company also belongs to the Jardine Matheson group, which can matter because long-term sponsorship and access to established business networks may support disciplined execution.
Recent company updates have also highlighted continued activity in luxury residential and mixed-use developments across Asia. That does not eliminate cyclicality, but it does mean the business is not relying only on one city or one property type for future progress.
Risks
This article is for informational purposes only and does not constitute financial advice. Some content is AI-generated. See Disclaimer


