Stock Analysis · Hammerson plc (HMSNF)
Overview
Hammerson plc is a U.K.-based real estate company focused on large retail destinations. Its portfolio is centered on shopping centers, outlet villages, and mixed-use urban assets in the U.K., Ireland, and France. In simple terms, Hammerson owns major places where people shop, eat, and spend leisure time, and it earns money mainly from leasing space to retailers and related property income.
The business has become more concentrated in flagship retail assets after several years of portfolio reshaping, asset sales, and balance-sheet repair. That matters because the company is not trying to compete across all property types. It is focusing on large, high-traffic retail locations where management believes strong brands still want physical space despite the rise of e-commerce.
Its revenue mix is primarily property income. Based on recent annual reporting and portfolio disclosures, the main sources of revenue can be summarized as follows:
- Shopping centers and urban retail destinations: approximately 60% to 70% of recurring gross rental income. This includes rent from major malls and city retail assets, plus related service income.
- Premium outlets: approximately 25% to 35% of recurring gross rental income. These outlet villages typically house discounted premium and luxury brands and often benefit from tourism and destination traffic.
- Other property and ancillary income: approximately 5% to 10%. This can include temporary leasing, parking, media, and other property-related receipts.
Geographically, the U.K. is the company’s largest market, followed by France and Ireland. That means Hammerson is exposed mainly to Western European consumer spending, retailer demand for prime physical locations, and property valuation trends in those markets.
The business mix over the last few years shows a company that has moved from losses and heavy financing pressure toward a more normalized operating profile. Revenue and operating profit have been volatile, which is common in listed real estate because asset sales, revaluations, and accounting adjustments can strongly affect reported results. A notable positive shift is that net income turned positive in the latest period shown, while interest expense remains a meaningful claim on cash generation.
Key Figures
| Metric | Value | Sector ⓘ |
|---|---|---|
| Date | Oct 17, 2026 | |
| Context | ||
| Sector | Real Estate | |
| Industry | REIT - Retail | |
| Market Cap ⓘ | $2.47B | |
| Beta ⓘ | 1.78 | |
Value (Cheapness) | ||
| P/E Ratio ⓘ | 7.83 | 17.38 |
| P/B Ratio ⓘ | 1.43 | 0.85 |
| FCF Yield ⓘ | -1.49% | 7.38% |
| Dividend Yield ⓘ | 4.31% | 4.85% |
| EBIT / EV ⓘ | N/A | 3.78% |
| PEG ⓘ | 1.87 | |
Growth (Business expansion) | ||
| Revenue Growth ⓘ | 39.90% | 5.30% |
| RPS Growth (5Y CAGR) ⓘ | 52.10% | 6.02% |
| EPS Growth (5Y CAGR) ⓘ | N/A | -11.37% |
| BVPS Growth (5Y CAGR) ⓘ | 56.78% | 0.45% |
| Margin Growth (5Y Trend) ⓘ | 354.18% | -0.22% |
| FCF Growth (5Y CAGR) ⓘ | N/A | 5.40% |
| DPS Growth (5Y CAGR) ⓘ | 120.99% | 5.02% |
Quality (Business durability) | ||
| ROIC (Latest) ⓘ | N/A | 5.69% |
| ROE (Latest) ⓘ | 14.22% | 7.56% |
| ROA (Latest) ⓘ | 7.33% | 2.85% |
| ROIC (5Y Median) ⓘ | 1.97% | 4.22% |
| ROE (5Y Median) ⓘ | -6.16% | 6.03% |
| ROA (5Y Median) ⓘ | -3.48% | 2.44% |
| Net Debt / EBIT (Latest) ⓘ | 3.64 | 7.59 |
| Net Debt / EBIT (5Y Median) ⓘ | 7.79 | 8.40 |
| Net Debt / EBITDA (Latest) ⓘ | 3.62 | 5.27 |
| Net Debt / Assets ⓘ | 31.96% | 37.76% |
| EBITDA / Interest ⓘ | 2.47 | 4.10 |
| Operating Margin (Latest) ⓘ | 84.12% | 35.29% |
| Operating Margin (5Y Median) ⓘ | 66.46% | 37.31% |
| Debt to Equity (Latest) ⓘ | 86.37% | 88.87% |
| Profit Margin (Latest) ⓘ | 67.48% | 19.61% |
| Free Cash Flow (Latest) ⓘ | -$36.68M | |
Momentum (Price trend) | ||
| 3Y Return ⓘ | +67.06% | +30.75% |
| 12M Return (excl. last month) ⓘ | +46.19% | +4.36% |
| 6M Return ⓘ | +3.31% | -2.52% |
| Price vs. 200-Day MA ⓘ | +26.44% | -2.34% |
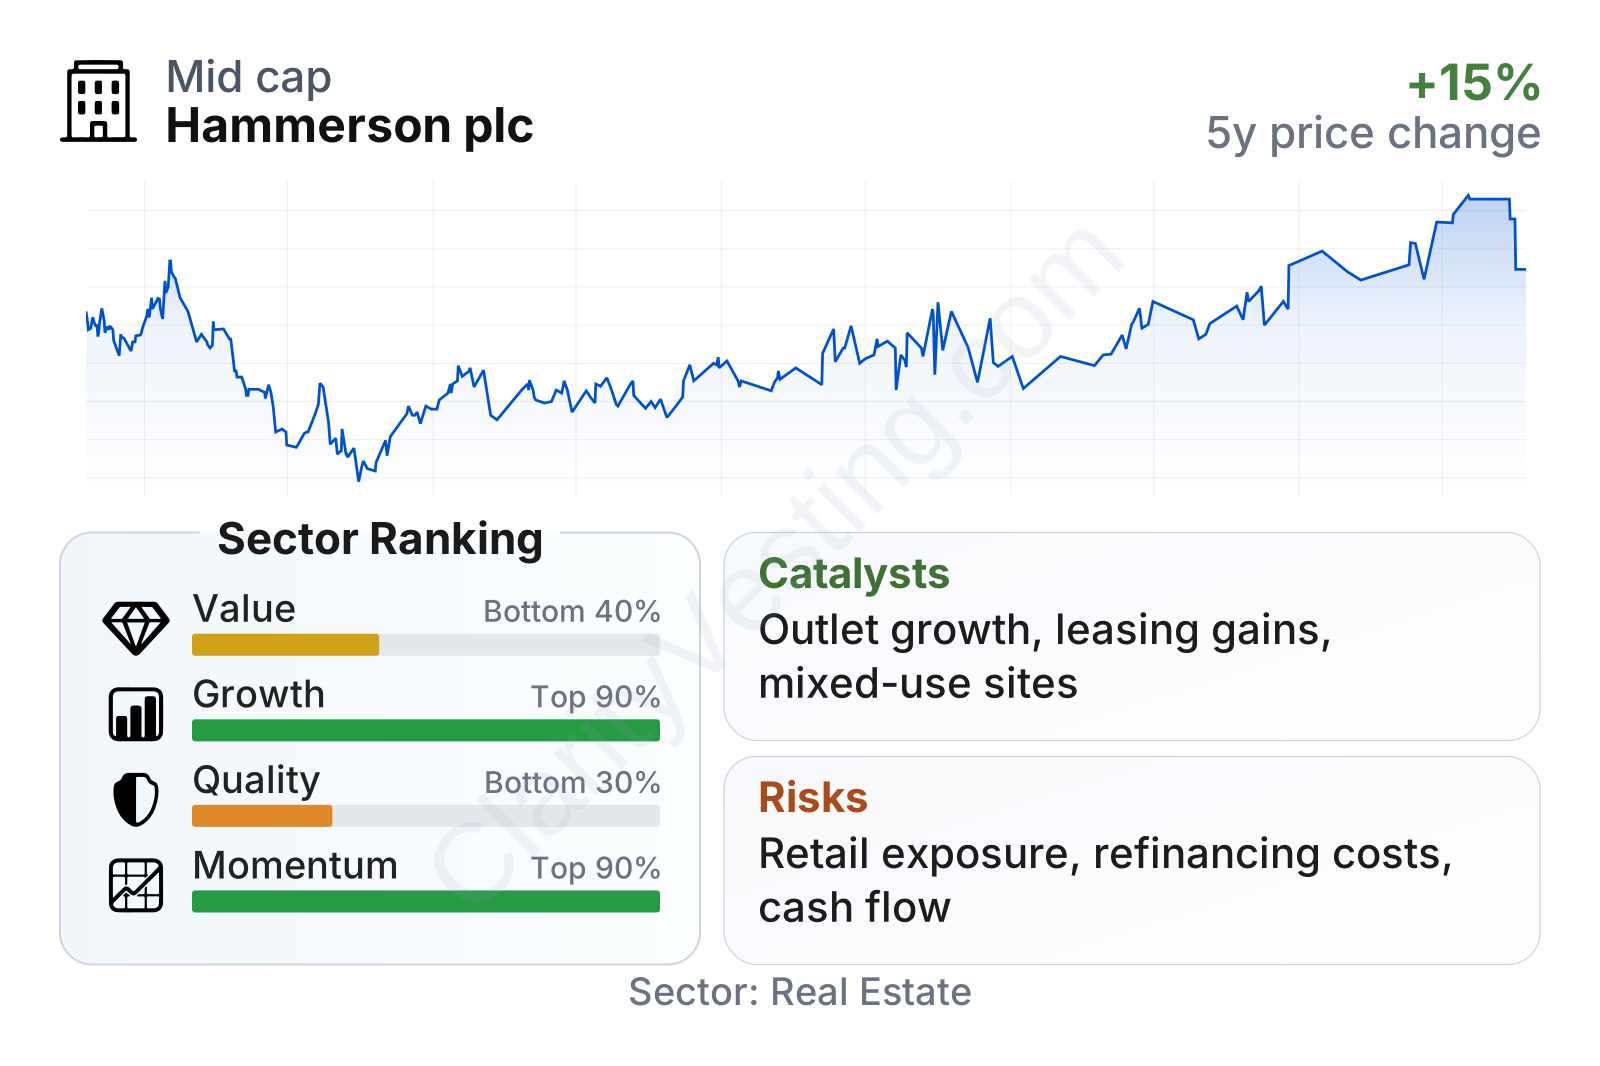
Hammerson is a mid-sized retail REIT by market value, and its recent market performance has been strong relative to much of the real estate sector. The metrics point to an unusual combination: very strong growth and momentum rankings, but weaker value and quality rankings. In practical terms, the market has rewarded the turnaround, yet the company still carries enough balance-sheet and cash-flow limitations to prevent it from screening as a consistently high-quality operator.
The latest figures also show some clear contradictions that matter for long-term analysis. Profitability ratios and operating margins look strong, and leverage against earnings is lower than the sector median. However, free cash flow is still negative and interest coverage is below the sector median, which means debt is more manageable than before but financing costs are still an important constraint.
Growth
Hammerson operates in a sector that is no longer seen as a broad structural growth area in the way logistics, data centers, or residential rental housing can be. Physical retail real estate faces pressure from e-commerce, changing shopping habits, and retailer bankruptcies. Even so, the top end of the market has been more resilient than weaker secondary locations. Prime malls and outlet centers can still grow if they offer strong footfall, tenant demand, and a better mix of shopping, dining, and entertainment.
That is where Hammerson’s strategy makes sense. The company has spent recent years simplifying the portfolio, reducing debt, and concentrating on larger flagship assets. The idea is straightforward: fewer weak assets, more focus on dominant retail locations, and more flexibility to improve leasing spreads, occupancy, and redevelopment returns. For a landlord in retail real estate, this is a more credible path than trying to defend a broad portfolio of average assets.
The revenue-per-share trend shows how uneven the recovery has been, but it also highlights that the business is operating from a stronger base than it was several years ago. The large jump in recent years suggests that portfolio reshaping and improved asset performance have had a meaningful effect, even if the line is not smooth enough to describe as steady compounding yet.
The dividend record also reflects a rebuilding phase rather than a mature, predictable income pattern. The payout has recovered materially from earlier low levels, which signals improved confidence in recurring earnings and cash generation. Still, the recent pattern remains volatile enough to show that management is balancing shareholder distributions against debt reduction and asset investment needs.
One of the strongest growth indicators is relative performance versus the sector. Revenue growth, book value growth, and dividend-per-share growth have all ranked near the top of the peer group. This suggests the company is still benefiting from a turnaround phase, where improvements can look dramatic because they are measured against depressed prior levels.
Recent company updates have also emphasized active asset management, leasing progress, and continued work on mixed-use development opportunities around core sites. For Hammerson, this is an important catalyst because high-quality retail destinations increasingly need to function as broader urban places rather than pure shopping venues. If management executes well, that can support rental growth, higher occupancy, and better long-term asset values.
Risks
This article is for informational purposes only and does not constitute financial advice. Some content is AI-generated. See Disclaimer


