Stock Analysis · Hamilton Lane Inc (HLNE)
Overview
Hamilton Lane is an alternative asset management firm focused mainly on private markets. In simple terms, it helps institutions and wealthy clients invest in assets that are not traded on public stock exchanges, such as private equity, private credit, real assets, and venture-backed businesses. The company operates globally and sits more on the “allocator and adviser” side of private markets than on the traditional mutual fund side of asset management.
Its business model combines recurring management fees, advisory fees, and performance-related income. Hamilton Lane also invests some of its own capital alongside clients, which can add upside in strong markets but also brings more earnings variability.
The main revenue sources are broadly structured as follows:
- Management and advisory fees: approximately 70% to 80% of revenue in recent years. This includes fees tied to assets under management and supervision, portfolio construction, reporting, and customized private market solutions for institutions and intermediaries.
- Incentive fees and carried interest: approximately 15% to 25%. These are performance-based earnings generated when funds or accounts exceed return hurdles or realize gains.
- Investment income and other revenue: generally less than 10%. This comes from Hamilton Lane’s balance sheet investments, interest income, and smaller related items.
That mix matters for long-term analysis. The fee-based portion brings recurring income and visibility, while incentive fees and principal investment gains can make results stronger in good years and less predictable in weaker fundraising or exit environments.
Hamilton Lane’s financial profile also shows a scalable model: revenue has grown meaningfully over the last several years, and operating income has expanded faster than overhead. The broad flow from revenue to profit suggests a business with strong margins for the asset management industry, even after compensation and administrative costs.
Over the last five fiscal years, revenue and operating profit have both trended upward, and operating income has recently accelerated faster than sales. That points to a business where scale is improving economics rather than simply adding volume.
Key Figures
| Metric | Value | Sector ⓘ |
|---|---|---|
| Date | Oct 17, 2026 | |
| Context | ||
| Sector | Financial Services | |
| Industry | Asset Management | |
| Market Cap ⓘ | $5.50B | |
| Beta ⓘ | 1.25 | |
Value (Cheapness) | ||
| P/E Ratio ⓘ | 12.64 | 12.26 |
| P/B Ratio ⓘ | 24.37 | 1.23 |
| FCF Yield ⓘ | 7.14% | 10.40% |
| Dividend Yield ⓘ | 2.68% | 3.02% |
| EBIT / EV ⓘ | 11.19% | 8.14% |
| PEG ⓘ | 1.39 | |
Growth (Business expansion) | ||
| Revenue Growth ⓘ | 56.50% | 9.35% |
| RPS Growth (5Y CAGR) ⓘ | 19.39% | 12.19% |
| EPS Growth (5Y CAGR) ⓘ | -14.30% | -9.53% |
| BVPS Growth (5Y CAGR) ⓘ | 11.46% | 4.99% |
| Margin Growth (5Y Trend) ⓘ | -23.56% | -3.86% |
| FCF Growth (5Y CAGR) ⓘ | 29.62% | 4.81% |
| DPS Growth (5Y CAGR) ⓘ | 9.45% | 8.79% |
Quality (Business durability) | ||
| ROIC (Latest) ⓘ | 38.31% | 9.49% |
| ROE (Latest) ⓘ | 81.14% | 13.90% |
| ROA (Latest) ⓘ | 12.21% | 1.55% |
| ROIC (5Y Median) ⓘ | 36.37% | 7.86% |
| ROE (5Y Median) ⓘ | 56.98% | 12.17% |
| ROA (5Y Median) ⓘ | 12.01% | 1.30% |
| Net Debt / EBIT (Latest) ⓘ | 0.05 | 0.96 |
| Net Debt / EBIT (5Y Median) ⓘ | 0.55 | 0.73 |
| Net Debt / EBITDA (Latest) ⓘ | 0.05 | 0.92 |
| Operating Margin (Latest) ⓘ | 61.98% | 22.30% |
| Operating Margin (5Y Median) ⓘ | 52.87% | 24.63% |
| Debt to Equity (Latest) ⓘ | 38.84% | 58.56% |
| Profit Margin (Latest) ⓘ | 32.14% | 26.57% |
| Free Cash Flow (Latest) ⓘ | $392.70M | |
Momentum (Price trend) | ||
| 3Y Return ⓘ | +1.67% | +88.33% |
| 12M Return (excl. last month) ⓘ | -35.20% | +19.38% |
| 6M Return ⓘ | -19.43% | +4.75% |
| Price vs. 200-Day MA ⓘ | -16.17% | +3.50% |
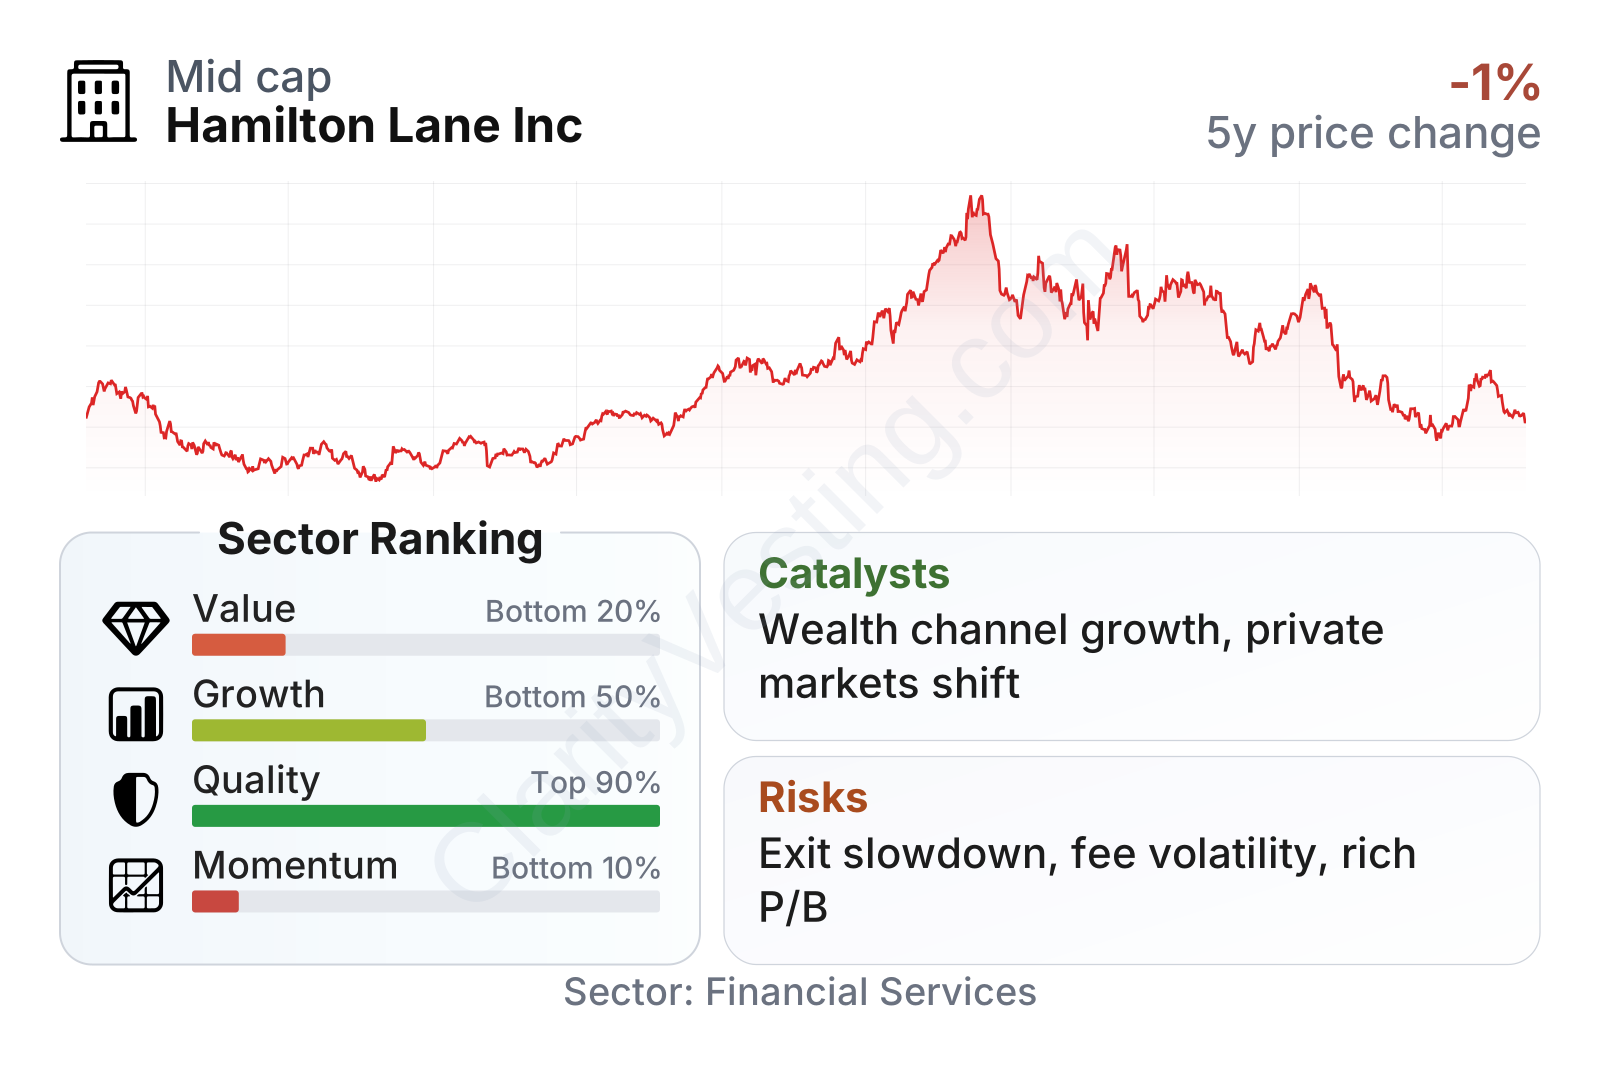
Hamilton Lane stands out for business quality more than for cheap valuation or recent share-price strength. Profitability metrics are far above the sector median, leverage is modest, and free cash flow is solid. Growth indicators are mixed: revenue expansion has been strong, but earnings growth over a five-year window still reflects some volatility tied to performance fees and market conditions. The weakest area is momentum, with the shares well below recent highs and lagging much of the broader financial sector.
The stock’s path over the past few years shows how sentiment can swing for alternative asset managers. After a strong run into 2024 and early 2025, the shares pulled back sharply in 2026. That decline matters because it changed the short-term market view even though the underlying business remains highly profitable.
Growth
Hamilton Lane operates in a part of finance that has had a long runway for expansion: private markets. Large institutions have steadily increased allocations to private equity, private credit, infrastructure, and other non-public assets in search of diversification and higher long-term returns. A second growth avenue is the gradual expansion of private market access to wealth channels, including financial advisers and high-net-worth clients. That broadening investor base can support asset growth for firms with established platforms and distribution relationships.
Its strategy makes sense in that context. Hamilton Lane is not trying to compete only as a mega-buyout brand. Instead, it positions itself as a platform that offers fund investments, direct co-investments, secondaries, evergreen products, and advisory solutions. That diversification can help it capture demand across different client types and market conditions. It also gives the firm multiple ways to monetize relationships instead of relying on a single flagship fund cycle.
Recent operating performance supports the growth case. Revenue has compounded well over the past five years, and free cash flow growth has been especially strong. The latest fiscal year also showed another step up in total revenue, operating profit, and net income. Even though private markets have faced a slower exit environment at times, Hamilton Lane has still managed to expand its earnings base.
Earnings per share show some year-to-year variability, which is common in alternative asset managers, but the broader direction has improved since fiscal 2023. More recent annual results indicate that profit growth has resumed after that softer period.
Book value per share increased strongly over several years before dropping in the latest annual reading. For this company, book value is less straightforward than for a bank because balance sheet investments and valuation marks can move around. The longer trend still points to business value creation, but it also highlights that reported equity can be uneven from year to year.
A meaningful catalyst is the continued institutionalization of private markets. Hamilton Lane benefits when pension funds, insurers, sovereign funds, and wealth platforms need specialized access, manager selection, and portfolio analytics. Another catalyst is the growth of evergreen and semi-liquid private market products, which can expand the addressable market beyond traditional closed-end institutional mandates.
Recent company communications have also emphasized product expansion, platform scaling, and international distribution. For a firm of Hamilton Lane’s size, success in wealth channels and global client growth could have an outsized impact because fee-bearing assets can rise without a proportional increase in costs.
Risks
This article is for informational purposes only and does not constitute financial advice. Some content is AI-generated. See Disclaimer


