Stock Analysis · Hikma Pharmaceuticals PLC (HKMPY)
Overview
Hikma Pharmaceuticals PLC is a multinational drugmaker focused on generic medicines, injectable products, and branded medicines sold mainly across the United States, the Middle East, and North Africa. The company was founded in Jordan and is listed in London, while HKMPY is the U.S. over-the-counter ticker for its shares. Its business model is relatively easy to understand: Hikma develops, manufactures, and sells medicines that are already well known to doctors and health systems, often competing on manufacturing quality, regulatory execution, product availability, and cost rather than on blockbuster patent-protected discovery.
The company reports three main business segments. Based on its latest annual reporting, revenue sources can be summarized as follows:
- Injectables: about 42% of revenue. This includes sterile injectable medicines used in hospitals and clinics, such as generic injectable drugs and some specialized products.
- Generics: about 31% of revenue. This business is primarily centered on the U.S. market and includes oral and other non-injectable generic medicines.
- Branded: about 27% of revenue. This segment mainly serves the Middle East and North Africa with branded generic and licensed products sold through local commercial networks.
That mix matters because it gives Hikma more than one profit engine. Injectables tend to benefit from manufacturing know-how and regulatory barriers, U.S. Generics offers scale and launch opportunities, and Branded provides regional diversification with established customer relationships. Over the last several years, total revenue has moved from roughly $2.6 billion to more than $3.3 billion, while profitability has recovered after a weaker period in 2022 and 2023.
The business flow shows a company that has expanded revenue steadily since 2022, with operating income and net income improving meaningfully in 2024 and 2025. One useful point for long-term readers is that selling, general, and administrative costs and research spending have not risen as fast as revenue in the most recent period, which suggests better operating discipline after earlier margin pressure.
Key Figures
| Metric | Value | Sector ⓘ |
|---|---|---|
| Date | Oct 10, 2026 | |
| Context | ||
| Sector | Healthcare | |
| Industry | Drug Manufacturers - Specialty & Generic | |
| Market Cap ⓘ | $4.40B | |
| Beta ⓘ | 0.65 | |
Value (Cheapness) | ||
| P/E Ratio ⓘ | 12.07 | 24.79 |
| P/B Ratio ⓘ | 1.86 | 2.97 |
| FCF Yield ⓘ | 10.61% | 3.11% |
| Dividend Yield ⓘ | 4.05% | 2.04% |
| EBIT / EV ⓘ | 20.38% | 0.57% |
| PEG ⓘ | 2.41 | |
Growth (Business expansion) | ||
| Revenue Growth ⓘ | 4.20% | 7.35% |
| RPS Growth (5Y CAGR) ⓘ | 8.30% | 8.61% |
| EPS Growth (5Y CAGR) ⓘ | -3.25% | -18.43% |
| BVPS Growth (5Y CAGR) ⓘ | 2.42% | 3.94% |
| Margin Growth (5Y Trend) ⓘ | -6.50% | -0.61% |
| FCF Growth (5Y CAGR) ⓘ | -20.62% | 0.88% |
| DPS Growth (5Y CAGR) ⓘ | 12.76% | 6.74% |
Quality (Business durability) | ||
| ROIC (Latest) ⓘ | 24.27% | 3.34% |
| ROA (Latest) ⓘ | 13.79% | 2.95% |
| ROIC (5Y Median) ⓘ | 12.25% | 4.60% |
| ROA (5Y Median) ⓘ | 7.32% | 1.89% |
| Net Debt / EBIT (Latest) ⓘ | 1.36 | 1.36 |
| Net Debt / EBIT (5Y Median) ⓘ | 2.11 | 1.86 |
| Net Debt / EBITDA (Latest) ⓘ | 1.01 | 1.02 |
| Net Debt / Assets ⓘ | 29.06% | 5.85% |
| EBITDA / Interest ⓘ | 8.33 | 9.60 |
| Operating Margin (Latest) ⓘ | 18.79% | 9.19% |
| Operating Margin (5Y Median) ⓘ | 16.96% | 7.53% |
| Debt to Equity (Latest) ⓘ | 77.57% | 29.44% |
| Profit Margin (Latest) ⓘ | 11.32% | 3.52% |
| Free Cash Flow (Latest) ⓘ | $466.63M | |
Momentum (Price trend) | ||
| 3Y Return ⓘ | -3.25% | +34.80% |
| 12M Return (excl. last month) ⓘ | -1.64% | +19.33% |
| 6M Return ⓘ | +25.11% | +7.18% |
| Price vs. 200-Day MA ⓘ | +4.82% | +3.20% |
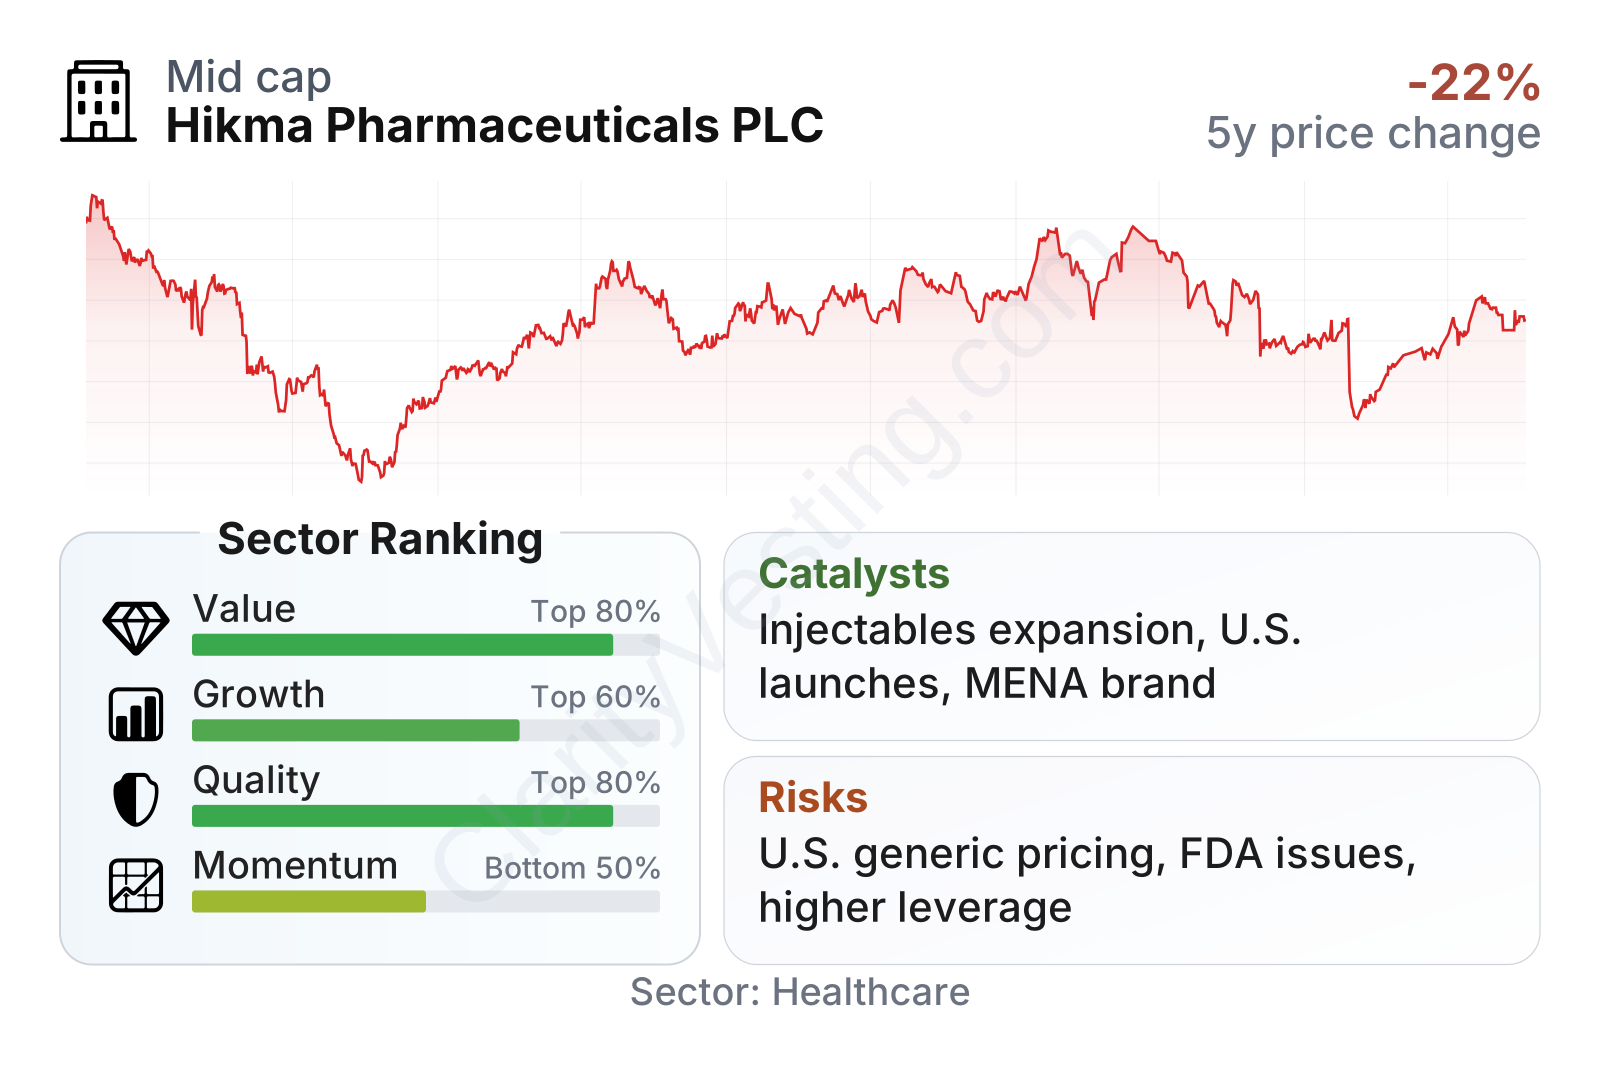
Hikma looks stronger on profitability and cash generation than many healthcare peers of similar size. Returns on capital and assets are well above sector medians, operating margin is materially higher than typical sector levels, and free cash flow generation is solid. Growth indicators are more mixed: revenue has been rising, but margin trends and free cash flow growth over a multi-year period are less impressive than the quality metrics. Share price performance has also lagged the broader healthcare group over longer periods, even though the shorter-term trend has improved.
The stock has also shown lower volatility than the market overall, as reflected by a beta below 1. For readers who prefer stability in business performance, that can be a useful feature, although lower volatility does not remove operating or regulatory risk.
Growth
Hikma operates in a sector with durable long-term demand. Medicines are tied to aging populations, chronic disease treatment, hospital utilization, and the ongoing need for lower-cost generic alternatives. That does not automatically make every pharmaceutical manufacturer a growth company, but it does create a favorable baseline: healthcare systems around the world continue to look for reliable suppliers that can keep treatment costs under control.
Hikma’s strategy is sensible for that environment. In Injectables, the company focuses on complex manufacturing capabilities, which are harder to replicate than standard oral generics. In the U.S. Generics business, the opportunity comes from new product launches, a broad product portfolio, and the ability to capture market share when competitors exit or face supply issues. In Branded, Hikma benefits from a local commercial footprint across the Middle East and North Africa, where established physician and pharmacy relationships can support resilient demand.
A notable growth catalyst is the company’s positioning in sterile injectables, an area where quality systems, plant approvals, and supply reliability can matter as much as price. Hospitals do not simply switch suppliers without considering continuity and compliance, which can support a more durable competitive position than in more commoditized drug categories.
Another support for future expansion is financial flexibility. Hikma remains cash generative, with trailing free cash flow around the high hundreds of millions of dollars range, and its current earnings base is stronger than it was during the post-2021 dip. That gives it room to invest in capacity, product filings, and bolt-on business development while continuing shareholder distributions.
Recent company updates in 2026 have continued to emphasize the resilience of Injectables and product pipeline execution in Generics. For long-term analysis, the most important point is not a single headline but the broader pattern: Hikma appears to be building around categories where manufacturing capability and regulatory execution can create repeat business rather than one-time demand spikes.
Risks
This article is for informational purposes only and does not constitute financial advice. Some content is AI-generated. See Disclaimer


