Stock Analysis · Hims Hers Health Inc (HIMS)
Overview
Hims & Hers Health is a digital health company built around online access to care. It started with a focus on conditions that many people prefer to handle privately, such as hair loss, sexual health, mental health, and dermatology, and has expanded into broader areas including weight management and primary-care-style services. The company combines telehealth visits, prescription fulfillment, subscriptions, and consumer branding in one platform. In simple terms, it tries to make healthcare faster, easier to access, and more consumer-friendly than the traditional clinic-and-pharmacy route.
The business model is largely recurring. Customers typically subscribe to treatments or wellness products, and the company earns revenue from the sale of those products and related clinical services delivered through its platform. Based on recent company disclosures, revenue is heavily concentrated in online consumer healthcare sales rather than enterprise or advertising activities.
The main revenue sources can be summarized as follows:
- Online revenue: about 95%+ of total revenue. This includes prescription and non-prescription products sold directly to consumers through the Hims and Hers websites and apps, along with telehealth-related services tied to those purchases.
- Wholesale revenue: about 1% to 5% of total revenue. This includes products distributed through third-party retail and commercial partners.
Within online revenue, the largest therapeutic categories have recently included sexual health, dermatology, mental health, and increasingly weight management. The exact mix by category changes over time, and newer offerings such as GLP-1-related weight loss services have become an important growth driver. That matters because it shows the company is not only a telehealth marketplace; it is also building a broader consumer health platform with cross-selling potential across multiple treatment areas.
The financial profile has changed meaningfully in a few years. Revenue scaled from roughly $272 million in 2021 to about $2.35 billion in 2025, while the business moved from heavy losses to positive net income in 2024 and remained profitable for full-year 2025. Gross profit has also expanded rapidly, suggesting the platform has meaningful operating leverage when customer acquisition remains efficient.
The progression is notable: sales have grown very quickly, gross profit has widened, and the company turned operating profit positive in 2024 and improved further in 2025. At the same time, selling, general, and administrative costs remain a major expense line, which is typical for a consumer internet health platform that depends on marketing and brand visibility.
Key Figures
| Metric | Value | Sector ⓘ |
|---|---|---|
| Date | Oct 24, 2026 | |
| Context | ||
| Sector | Healthcare | |
| Industry | Drug Manufacturers - Specialty & Generic | |
| Market Cap ⓘ | $6.82B | |
| Beta ⓘ | 2.43 | |
Value (Cheapness) | ||
| P/E Ratio ⓘ | N/A | 25.42 |
| P/B Ratio ⓘ | 20.83 | 3.08 |
| FCF Yield ⓘ | 1.32% | 3.12% |
| Dividend Yield ⓘ | N/A | 1.85% |
| EBIT / EV ⓘ | -2.23% | 0.56% |
| PEG ⓘ | 2.59 | |
Growth (Business expansion) | ||
| Revenue Growth ⓘ | 38.20% | 7.50% |
| RPS Growth (5Y CAGR) ⓘ | 58.09% | 8.60% |
| EPS Growth (5Y CAGR) ⓘ | -2.59% | -17.73% |
| BVPS Growth (5Y CAGR) ⓘ | 3.99% | 3.72% |
| Margin Growth (5Y Trend) ⓘ | N/A | -0.57% |
| FCF Growth (5Y CAGR) ⓘ | N/A | 0.96% |
| DPS Growth (5Y CAGR) ⓘ | N/A | 6.69% |
Quality (Business durability) | ||
| ROIC (Latest) ⓘ | -7.45% | 3.17% |
| ROA (Latest) ⓘ | -4.85% | 2.98% |
| ROIC (5Y Median) ⓘ | -5.13% | 4.56% |
| ROA (5Y Median) ⓘ | -5.83% | 1.87% |
| Net Debt / EBIT (Latest) ⓘ | N/A | 1.34 |
| Net Debt / EBIT (5Y Median) ⓘ | N/A | 1.86 |
| Net Debt / EBITDA (Latest) ⓘ | N/A | 1.00 |
| Net Debt / Assets ⓘ | 25.81% | 5.06% |
| EBITDA / Interest ⓘ | N/A | 9.55 |
| Operating Margin (Latest) ⓘ | -6.35% | 9.25% |
| Operating Margin (5Y Median) ⓘ | -2.47% | 7.33% |
| Debt to Equity (Latest) ⓘ | 477.13% | 26.68% |
| Profit Margin (Latest) ⓘ | -5.51% | 3.34% |
| Free Cash Flow (Latest) ⓘ | $89.89M | |
Momentum (Price trend) | ||
| 3Y Return ⓘ | +370.60% | +51.61% |
| 12M Return (excl. last month) ⓘ | -47.26% | +19.90% |
| 6M Return ⓘ | +0.41% | +10.10% |
| Price vs. 200-Day MA ⓘ | +7.23% | +6.44% |
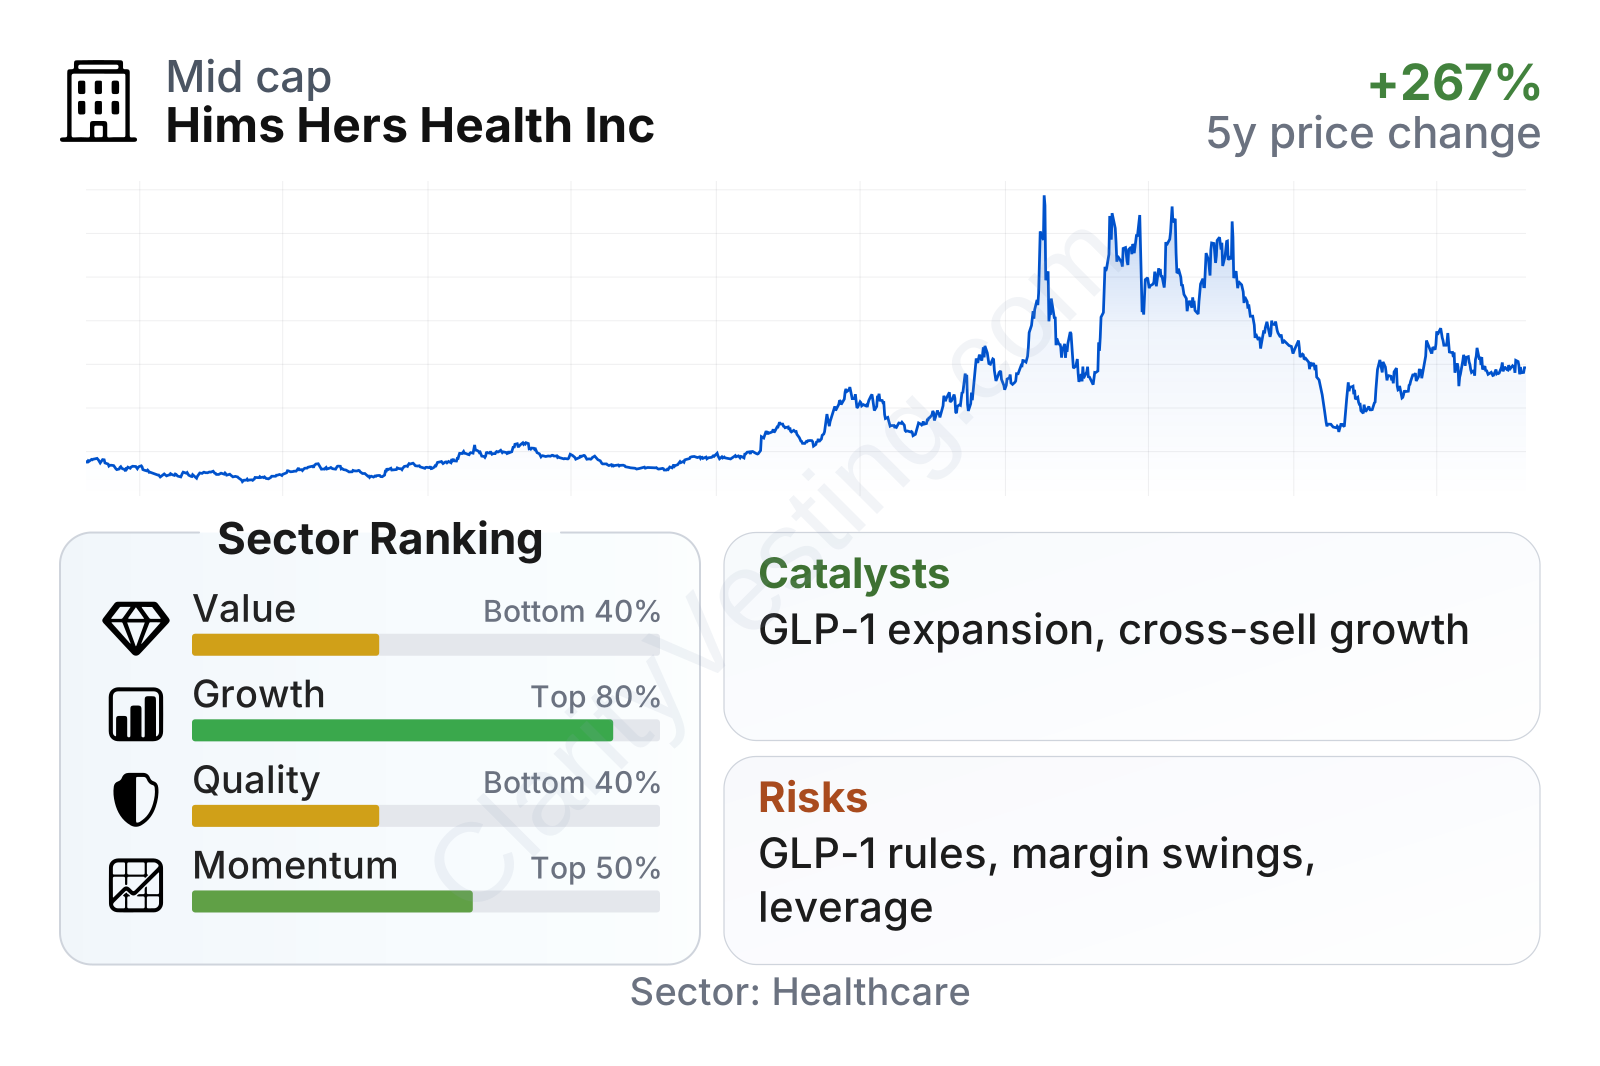
The overall picture is mixed but easy to read. Hims & Hers ranks strongly on growth and recent share-price momentum versus much of the healthcare sector, but it looks weaker on value and quality measures. That combination usually means the market is paying up for expansion, while profitability and balance-sheet efficiency still need to mature further.
The stock has also been very volatile. Over the last several years, the share price moved from low single digits to above $50 before pulling back sharply and then recovering. That pattern shows strong enthusiasm around the business, but also changing expectations around profitability, competition, and the sustainability of newer growth drivers.
In size terms, Hims & Hers is no longer a tiny early-stage company, but it is still much smaller than large healthcare incumbents. Its beta above 2 suggests that the stock has tended to move much more than the broader market, which is an important feature for long-term readers to keep in mind.
Growth
Hims & Hers operates in a part of healthcare that still appears to have a long runway: digitally delivered care, direct-to-consumer treatment, and subscription-based medication fulfillment. Several broad trends support this market. Consumers are increasingly comfortable receiving care online, many common conditions are well suited to asynchronous or remote treatment, and convenience has become a major factor in healthcare choices. Weight management is another large and still developing market, especially as GLP-1 therapies have expanded public awareness and demand.
The company’s strategy makes sense in that context. It uses a single consumer brand platform to acquire customers, then expands wallet share through additional treatments and services. This can be powerful if customer acquisition costs remain under control, because one user may eventually purchase products across several categories. The model also benefits from repeat purchasing behavior, which can create more predictable revenue than one-time transactions.
Growth has been exceptional over the past few years, even though the pace has become less uniform. Earlier periods showed extremely high year-over-year increases, then growth moderated, and more recently it reaccelerated before slowing again. The latest trend still points to growth far above the sector median, which supports the idea that the company continues to capture share in digital-first healthcare.
Cash generation has improved sharply from negative territory to solidly positive levels, although it has also been uneven. That matters because it suggests the business is no longer relying only on revenue growth to make the model look attractive; it has also shown an ability to translate scale into real cash flow. Even with some pullback from peak levels, positive free cash flow gives the company more flexibility to invest in marketing, technology, and category expansion.
A major recent catalyst has been the company’s push into weight-loss care, including compounded GLP-1 offerings where legally permitted and broader personalized weight-management programs. This area can materially enlarge the addressable market because weight care is both large and highly visible. The company has also expanded its platform through diagnostics, lab partnerships, and broader primary-care-oriented services, which can deepen customer relationships over time rather than keeping interactions limited to a single prescription need.
Another favorable point is that management has increasingly emphasized platform depth rather than just top-line expansion. New service layers such as at-home testing, ongoing clinical support, and personalized treatment pathways can make the platform more useful and potentially harder to replace with a simple low-cost pharmacy option.
Risks
This article is for informational purposes only and does not constitute financial advice. Some content is AI-generated. See Disclaimer


