Stock Analysis · Hartford Financial Services Group (HIG)
Overview
The Hartford Financial Services Group is a large U.S. insurer focused mainly on property and casualty insurance, employee benefits, and a smaller life and retirement runoff business. In simple terms, it helps businesses and individuals protect themselves against financial losses from events such as workplace injuries, car accidents, home damage, lawsuits, disability, and other risks. The company also earns income by investing the premiums it collects before claims are paid, which is an important part of how insurers make money.
Hartford’s business mix is weighted toward commercial insurance, which makes it more of a business-focused insurer than a consumer-focused one. Based on the company’s recent reporting structure, the main operating earnings sources are approximately:
- Business Insurance: about 55% to 60% of core earnings. This includes workers’ compensation, general liability, commercial auto, property, professional liability, and other coverages sold to small, midsize, and large businesses.
- Personal Insurance: about 15% to 20%. This includes personal auto, homeowners, and related products.
- Employee Benefits: about 15% to 20%. This segment provides group disability, life, accident, and other benefits, often distributed through employers.
- Hartford Funds and other fee-based activities: about 5% to 10%. This area earns management and servicing fees rather than underwriting profit.
- Runoff operations: usually a small share and can vary from period to period. These are older life and annuity-related blocks that are no longer a strategic growth focus.
- Net investment income: not a standalone operating segment in the same way as underwriting lines, but it is a major contributor to total profitability across the group because Hartford invests its insurance float primarily in fixed-income securities and other assets.
The broad pattern in recent years has been favorable: revenue has grown from roughly $21.6 billion in 2021 to about $28.3 billion in 2025, while net income also climbed materially. That combination points to stronger underwriting and solid investment income, although accounting presentation for insurers can make some line items look unusually volatile from year to year.
Key Figures
| Metric | Value | Sector ⓘ |
|---|---|---|
| Date | Oct 31, 2026 | |
| Context | ||
| Sector | Financial Services | |
| Industry | Insurance - Diversified | |
| Market Cap ⓘ | $35.31B | |
| Beta ⓘ | 0.49 | |
Value (Cheapness) | ||
| P/E Ratio ⓘ | 8.84 | 12.20 |
| P/B Ratio ⓘ | 1.98 | 1.26 |
| FCF Yield ⓘ | 19.77% | 9.87% |
| Dividend Yield ⓘ | 1.85% | 2.87% |
| EBIT / EV ⓘ | 12.27% | 8.17% |
| PEG ⓘ | 0.12 | |
Growth (Business expansion) | ||
| Revenue Growth ⓘ | 3.90% | 8.40% |
| RPS Growth (5Y CAGR) ⓘ | 12.70% | 12.31% |
| EPS Growth (5Y CAGR) ⓘ | 7.78% | -4.03% |
| BVPS Growth (5Y CAGR) ⓘ | 7.59% | 4.96% |
| Margin Growth (5Y Trend) ⓘ | 4.13% | -4.14% |
| FCF Growth (5Y CAGR) ⓘ | 9.79% | 4.70% |
| DPS Growth (5Y CAGR) ⓘ | 10.62% | 8.85% |
Quality (Business durability) | ||
| ROIC (Latest) ⓘ | 16.73% | 9.35% |
| ROE (Latest) ⓘ | 24.32% | 13.95% |
| ROA (Latest) ⓘ | 5.32% | 1.57% |
| ROIC (5Y Median) ⓘ | 13.53% | 7.78% |
| ROE (5Y Median) ⓘ | 17.35% | 12.12% |
| ROA (5Y Median) ⓘ | 3.50% | 1.28% |
| Net Debt / EBIT (Latest) ⓘ | 0.87 | 0.99 |
| Net Debt / EBIT (5Y Median) ⓘ | 1.37 | 0.73 |
| Net Debt / EBITDA (Latest) ⓘ | 0.85 | 0.79 |
| Operating Margin (Latest) ⓘ | 16.65% | 22.61% |
| Operating Margin (5Y Median) ⓘ | 13.42% | 24.52% |
| Debt to Equity (Latest) ⓘ | 23.18% | 58.76% |
| Profit Margin (Latest) ⓘ | 15.57% | 26.18% |
| Free Cash Flow (Latest) ⓘ | $6.98B | |
Momentum (Price trend) | ||
| 3Y Return ⓘ | +91.89% | +95.34% |
| 12M Return (excl. last month) ⓘ | -3.13% | +16.22% |
| 6M Return ⓘ | -2.47% | +7.41% |
| Price vs. 200-Day MA ⓘ | -1.84% | +5.48% |
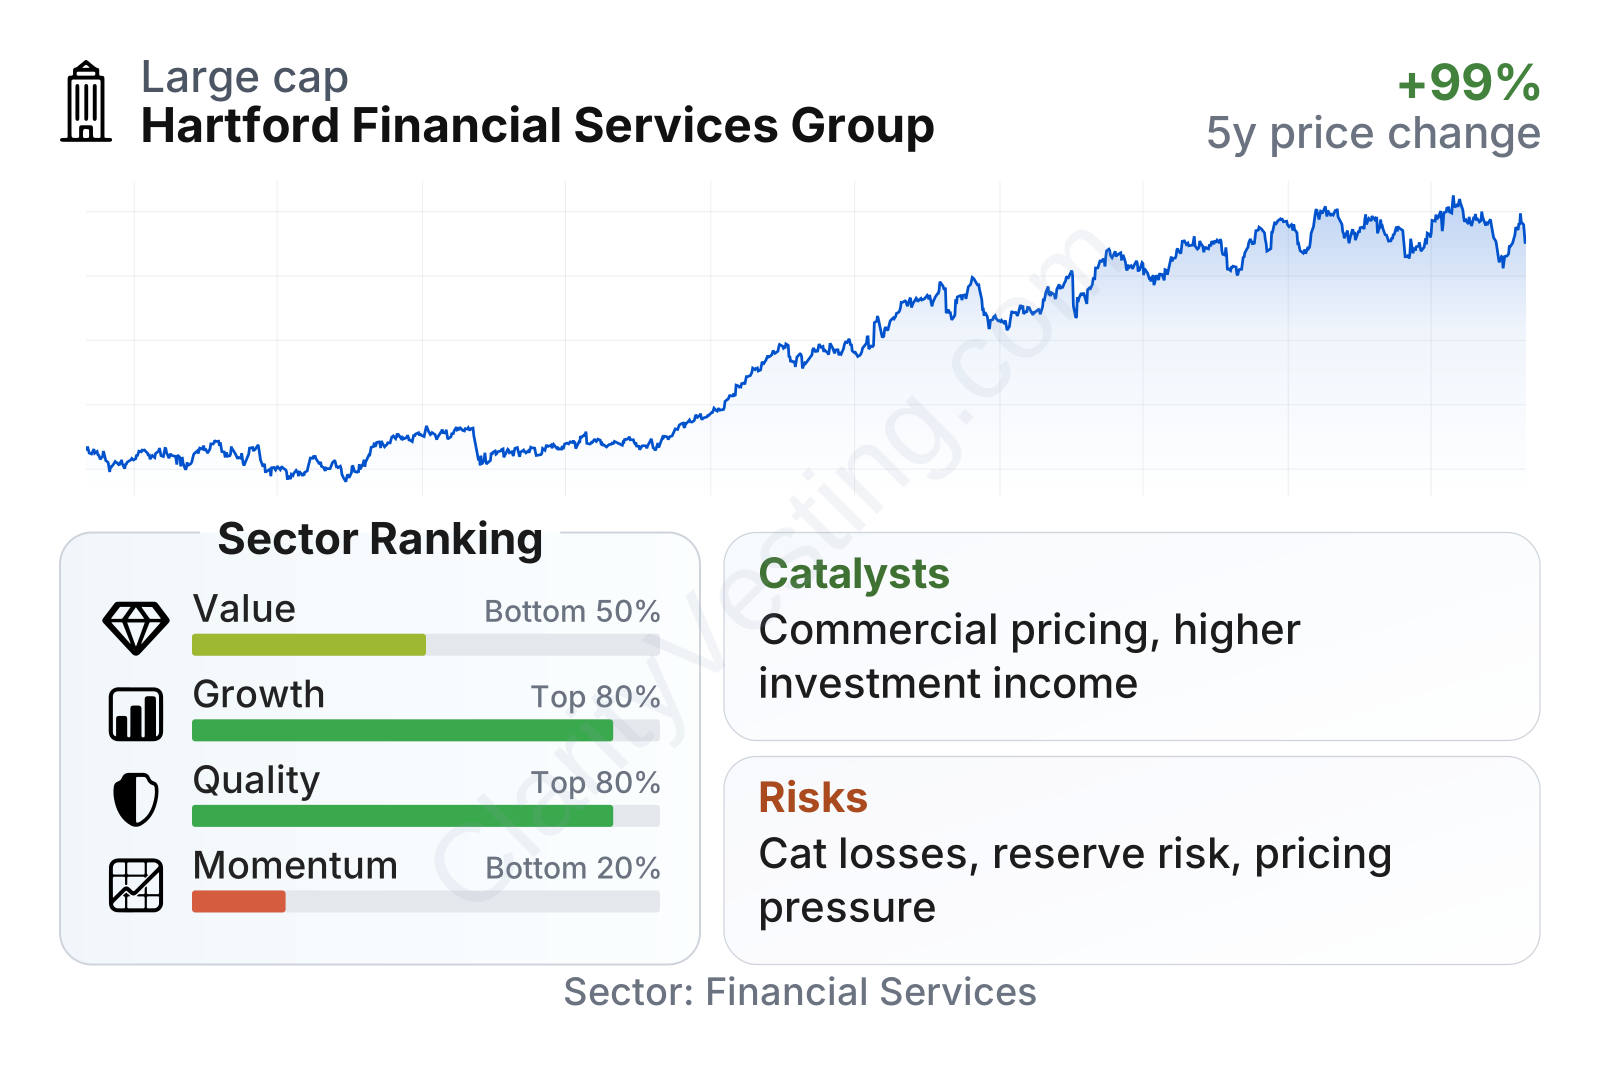
Hartford stands out more for quality and steady compounding than for short-term market momentum. Profitability metrics are clearly above the sector median, with return on equity above 24% and return on assets above 5%, both strong for an insurer. Leverage also looks moderate, with debt to equity near 23%, much lower than the sector median. On valuation, the picture is mixed: the earnings multiple is below the sector median, but the price-to-book ratio is meaningfully higher, suggesting the market is paying up for better execution and stronger returns. Recent share performance has been softer than much of the sector, which helps explain why the value profile looks more attractive on earnings than on book value.
Growth
Hartford operates in a sector that tends to grow with economic activity, payrolls, insured property values, medical costs, and replacement costs. That may sound modest, but it can be powerful when paired with pricing discipline. In commercial insurance especially, insurers can expand by raising premiums, improving risk selection, and keeping claims under control. Hartford has been doing all three in many of its core lines.
The company’s strategy is sensible for long-term expansion because it is concentrated in areas where scale, underwriting data, distribution relationships, and claims expertise matter. Business insurance remains the centerpiece, and that is important because commercial lines can generate attractive returns when pricing conditions are healthy. Employee benefits adds diversification and cross-selling opportunities with employer clients, while the runoff operations reduce the need to commit fresh capital to lower-growth legacy products.
Earnings progress has been strong over the last five years, and not just because of one favorable year. Earnings per share rose from a little above $6 in 2021 to more than $13 in 2025, while the five-year EPS growth rate is comfortably above the industry median.
Book value per share has also advanced well after the 2022 decline that affected many insurers holding bond portfolios during a period of rapidly rising interest rates. The recovery since then suggests Hartford has continued to build intrinsic capital strength while still returning cash to shareholders through dividends and buybacks.
Another supportive factor is interest rates. Insurers like Hartford typically invest large pools of premium income in bonds. Higher reinvestment yields can lift net investment income over time, which supports profit growth even if underwriting conditions become less favorable. This is especially relevant for Hartford because its mix combines underwriting income with a meaningful investment contribution.
Recent company updates have also emphasized ongoing share repurchases, dividend growth, and disciplined underwriting. None of these alone is a dramatic catalyst, but together they reinforce the picture of a mature insurer still finding room to compound earnings and book value. Continued commercial pricing discipline and stable catastrophe experience remain the clearest near- to medium-term upside drivers.
Risks
This article is for informational purposes only and does not constitute financial advice. Some content is AI-generated. See Disclaimer


