Stock Analysis · Howard Hughes Holdings Inc (HHH)
Overview
Howard Hughes Holdings Inc is a real estate development and operations company focused on creating, owning, and managing large-scale mixed-use communities and commercial properties in the United States. Its business is different from a traditional homebuilder or a pure office landlord. The company develops master planned communities, sells land to homebuilders and commercial users, builds and operates income-producing properties, and also develops condominium and other strategic projects. This gives it exposure to both recurring property income and more cyclical development profits.
Based on the company’s recent reporting structure, revenue mainly comes from three broad sources:
- Operating Assets: recurring revenue from office, retail, multifamily, hospitality, and other income-producing properties. This is typically the largest and most stable source because it includes rents and property-level operating income.
- Master Planned Communities: land sales in large communities such as The Woodlands, Summerlin, Bridgeland, and Teravalis. This segment can be highly profitable, but revenue can swing depending on the timing and size of land transactions.
- Strategic Developments: condominium sales and other major development projects. This tends to be the most volatile source because revenue often depends on project milestones, closings, and delivery schedules.
For the latest full-year mix, the exact percentage split can shift meaningfully from year to year because large land sales and condo closings can move results sharply. In recent periods, Operating Assets and Master Planned Communities have generally represented the core earnings base, while Strategic Developments has been more project-driven. That makes Howard Hughes a hybrid real estate company: part landlord, part land developer, and part long-duration community builder.
The business model matters for long-term analysis. A master planned community can generate value for decades as land is sold, homes are built, and commercial properties are added over time. That creates a long runway, but it also makes results less smooth than those of a more conventional real estate investment company.
The earnings profile has been uneven over the last several years, which is normal for a company with meaningful development exposure. Revenue and operating income rebounded strongly in 2024 after a weak 2023, then softened again in 2025. That pattern shows both the upside and the lumpiness built into the model: strong years can be driven by major transactions, but those gains are not always linear from one year to the next.
Key Figures
| Metric | Value | Sector ⓘ |
|---|---|---|
| Date | Oct 17, 2026 | |
| Context | ||
| Sector | Real Estate | |
| Industry | Real Estate - Development | |
| Market Cap ⓘ | $4.08B | |
| Beta ⓘ | 1.14 | |
Value (Cheapness) | ||
| P/E Ratio ⓘ | 13.82 | 17.38 |
| P/B Ratio ⓘ | 0.85 | 0.85 |
| FCF Yield ⓘ | 18.96% | 7.38% |
| Dividend Yield ⓘ | N/A | 4.85% |
| EBIT / EV ⓘ | 8.44% | 3.78% |
| PEG ⓘ | 5.55 | |
Growth (Business expansion) | ||
| Revenue Growth ⓘ | 330.20% | 5.30% |
| RPS Growth (5Y CAGR) ⓘ | -1.15% | 6.02% |
| EPS Growth (5Y CAGR) ⓘ | -7.12% | -11.37% |
| BVPS Growth (5Y CAGR) ⓘ | -2.10% | 0.45% |
| Margin Growth (5Y Trend) ⓘ | 9.07% | -0.22% |
| FCF Growth (5Y CAGR) ⓘ | N/A | 5.40% |
| DPS Growth (5Y CAGR) ⓘ | N/A | 5.02% |
Quality (Business durability) | ||
| ROIC (Latest) ⓘ | 4.79% | 5.69% |
| ROE (Latest) ⓘ | 6.81% | 7.56% |
| ROA (Latest) ⓘ | 2.20% | 2.85% |
| ROIC (5Y Median) ⓘ | 3.05% | 4.22% |
| ROE (5Y Median) ⓘ | 3.86% | 6.03% |
| ROA (5Y Median) ⓘ | 1.25% | 2.44% |
| Net Debt / EBIT (Latest) ⓘ | 5.06 | 7.59 |
| Net Debt / EBIT (5Y Median) ⓘ | 10.12 | 8.40 |
| Net Debt / EBITDA (Latest) ⓘ | 3.63 | 5.27 |
| Net Debt / Assets ⓘ | 17.70% | 37.76% |
| EBITDA / Interest ⓘ | 4.41 | 4.10 |
| Operating Margin (Latest) ⓘ | 23.45% | 35.29% |
| Operating Margin (5Y Median) ⓘ | 22.67% | 37.31% |
| Debt to Equity (Latest) ⓘ | 110.25% | 88.87% |
| Profit Margin (Latest) ⓘ | 12.31% | 19.61% |
| Free Cash Flow (Latest) ⓘ | $773.04M | |
Momentum (Price trend) | ||
| 3Y Return ⓘ | +11.48% | +30.75% |
| 12M Return (excl. last month) ⓘ | -23.57% | +4.36% |
| 6M Return ⓘ | +7.47% | -2.52% |
| Price vs. 200-Day MA ⓘ | +1.00% | -2.34% |
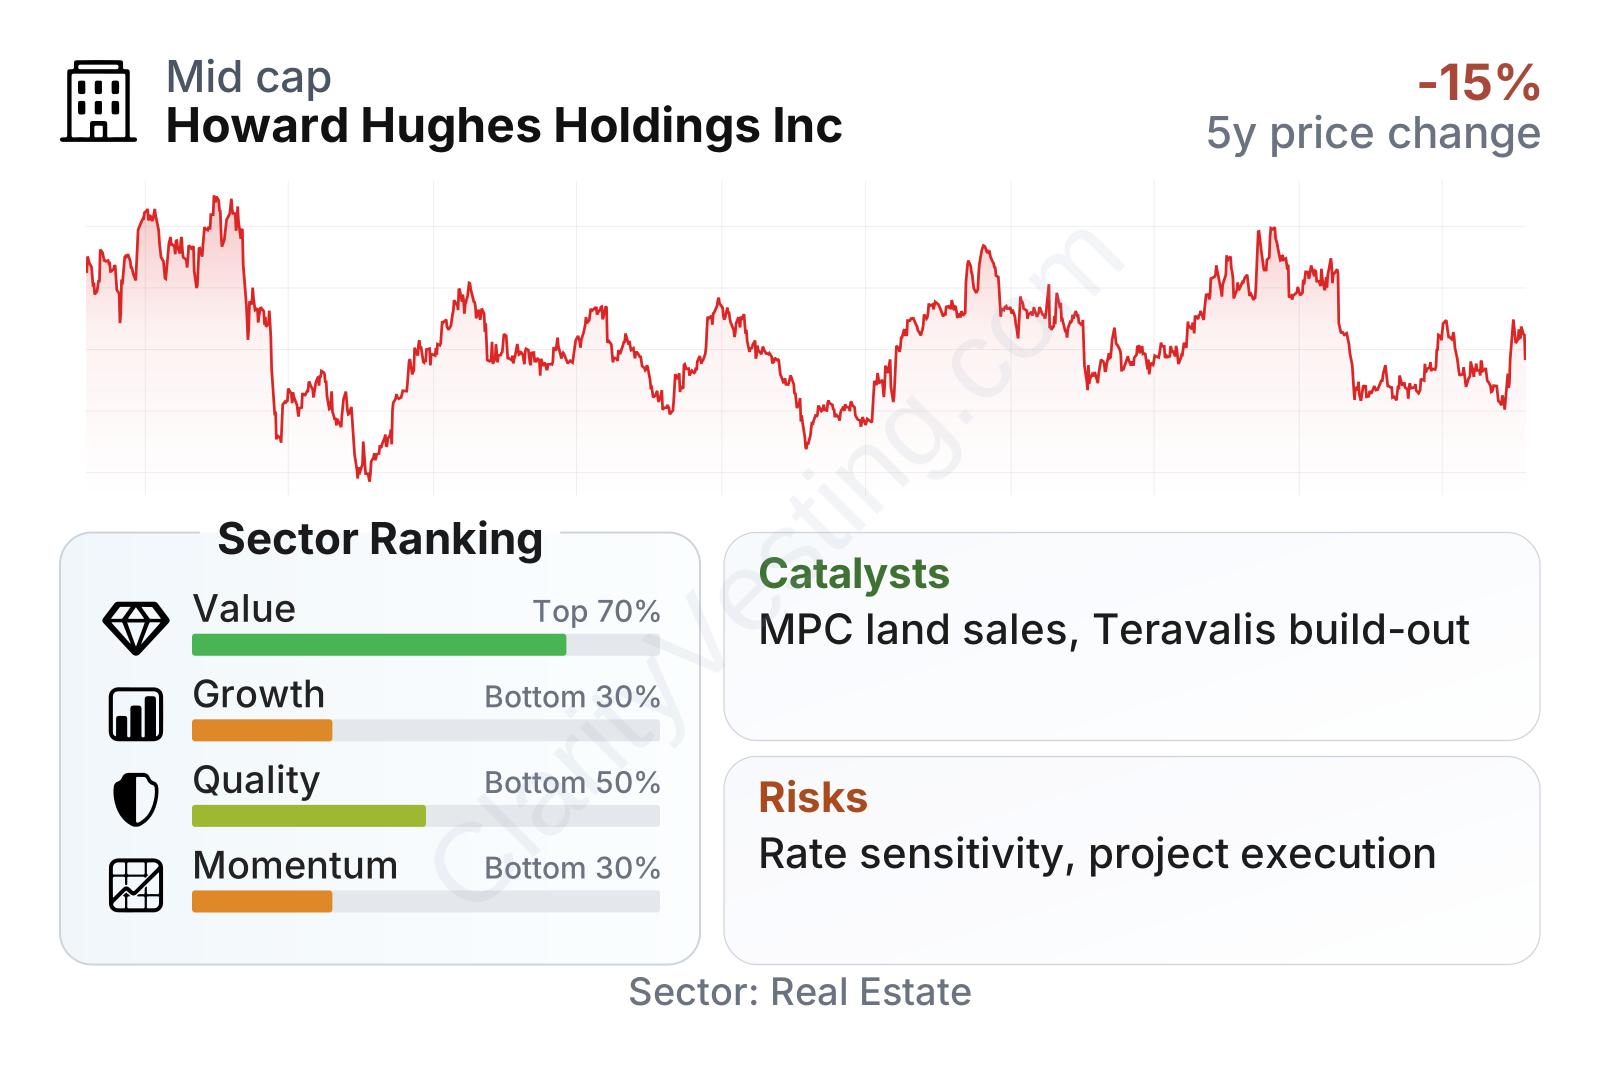
Howard Hughes sits in the mid-cap range and its share price has been volatile, which is not surprising for a real estate developer with cyclical earnings. On valuation, several metrics look reasonable relative to the broader real estate group, especially free cash flow yield and EBIT relative to enterprise value. Growth metrics are weaker, however, largely because the company’s results are uneven over multi-year periods. Quality measures are mixed: leverage is currently better than the sector median on some debt ratios, but profitability and returns on capital remain below many peers.
The recent market pattern also looks mixed rather than one-directional. The stock has recovered over the last six months and trades above its long-term moving average, but its longer three-year return still trails much of the sector. In simple terms, the market appears to recognize the asset base and cash generation, while still applying a discount for the company’s uneven operating record.
Growth
Howard Hughes operates in a part of real estate that can still grow over very long periods: large master planned communities in attractive markets. Population growth, business relocation, infrastructure build-out, and housing demand can all support this model. The most important point is that the company is not only collecting rent on existing buildings; it also owns land and development rights that can be monetized over time. That gives it a built-in pipeline if demand remains healthy in its core regions.
The strategy also makes sense on paper. The company can sell residential land to homebuilders, add retail and office space as communities mature, and eventually generate recurring cash flow from stabilized operating assets. In a successful community, one stage of development supports the next. This can create a compounding effect over many years, especially in markets with favorable demographic trends.
That said, growth has not been smooth. Revenue per share moved up sharply in 2024 after a drop in 2023, then fell again in 2025. This reinforces an important point for long-term readers: the growth case depends less on steady annual expansion and more on the gradual conversion of land and development inventory into cash flow and asset value. Recent year-over-year revenue growth has been very strong, but the five-year picture remains much less impressive.
A major catalyst is the company’s land bank within its master planned communities, especially in Sun Belt-oriented markets where housing demand and business formation have generally been more resilient than in slower-growth regions. Another potential driver is the continued maturation of communities such as Teravalis, where development can unfold over a very long horizon. If these communities continue attracting residents, employers, and builders, Howard Hughes has room to expand both land sales and recurring property income.
Recent company communications have also highlighted capital allocation and efforts to surface underlying asset value. For a business like Howard Hughes, that can matter as much as simple revenue growth because public market valuations often lag the value embedded in land, developments, and stabilized properties. If management executes well on project timing, leasing, and monetization, the gap between accounting results and real estate value can narrow.
Risks
This article is for informational purposes only and does not constitute financial advice. Some content is AI-generated. See Disclaimer


