Stock Analysis · Power Assets Holdings Limited (HGKGF)
Overview
Power Assets Holdings Limited is a Hong Kong-based utility owner and investor. Rather than operating as a fast-changing industrial company, it mainly owns stakes in electricity and gas-related infrastructure that generate recurring cash flow over long periods. Its portfolio includes power generation, power transmission and distribution, gas distribution, and other energy-related assets across Hong Kong, the United Kingdom, Australia, mainland China, continental Europe, New Zealand, Thailand, Canada, and the United States. This makes the business closer to a collection of regulated and contracted infrastructure assets than to a traditional high-growth power developer.
The company’s earnings are driven mainly by returns from its portfolio companies and joint ventures. Public disclosures show that its asset base is geographically diversified, with the United Kingdom and Australia representing especially important exposure alongside Hong Kong. The business model is designed to emphasize stable income, limited operational volatility, and disciplined capital allocation.
Revenue reporting for Power Assets can look unusual because accounting income from associates and joint ventures matters heavily, and that can make reported sales less informative than profit and cash generation. Based on the company’s structure and disclosures, the main economic sources of earnings are approximately:
- Electricity transmission and distribution: roughly the largest contributor, coming from regulated network assets that transport electricity and earn allowed returns.
- Power generation and related utility assets: a major contributor through stakes in electricity businesses serving households and commercial users.
- Gas distribution and related energy networks: a meaningful but smaller contribution from regulated or contracted gas infrastructure.
- Other infrastructure and support income: a smaller contribution that can include treasury income, corporate items, and other investment-related activities.
The broad picture is straightforward: Power Assets is primarily a defensive utility infrastructure owner with a long record of monetizing mature assets and recycling capital into other regulated energy networks.
The income profile highlights an important characteristic of the company: reported revenue has risen sharply in the last two years, while net income has stayed in a relatively steady range. That suggests the headline sales number is less important than underlying investment income, cash flow resilience, and how efficiently the portfolio is financed.
Key Figures
| Metric | Value | Sector ⓘ |
|---|---|---|
| Date | Oct 17, 2026 | |
| Context | ||
| Sector | Utilities | |
| Industry | Utilities - Independent Power Producers | |
| Market Cap ⓘ | $16.20B | |
| Beta ⓘ | 0.61 | |
Value (Cheapness) | ||
| P/E Ratio ⓘ | 7.04 | 17.28 |
| P/B Ratio ⓘ | 0.16 | 1.51 |
| FCF Yield ⓘ | 39.52% | 0.65% |
| Dividend Yield ⓘ | 37.11% | 3.77% |
| EBIT / EV ⓘ | N/A | 5.01% |
| PEG ⓘ | 52.37 | |
Growth (Business expansion) | ||
| Revenue Growth ⓘ | -15.30% | 6.10% |
| RPS Growth (5Y CAGR) ⓘ | 52.62% | 3.87% |
| EPS Growth (5Y CAGR) ⓘ | -44.13% | -11.30% |
| BVPS Growth (5Y CAGR) ⓘ | 1.15% | 4.23% |
| Margin Growth (5Y Trend) ⓘ | -109.60% | 3.57% |
| FCF Growth (5Y CAGR) ⓘ | -1.53% | -8.84% |
| DPS Growth (5Y CAGR) ⓘ | -0.00% | 4.84% |
Quality (Business durability) | ||
| ROIC (Latest) ⓘ | 6.76% | 6.53% |
| ROA (Latest) ⓘ | 23.61% | 3.20% |
| ROIC (5Y Median) ⓘ | 6.38% | 5.95% |
| ROA (5Y Median) ⓘ | 6.45% | 2.75% |
| Net Debt / EBIT (Latest) ⓘ | -2.19 | 7.13 |
| Net Debt / EBIT (5Y Median) ⓘ | 0.06 | 7.23 |
| Net Debt / EBITDA (Latest) ⓘ | -2.19 | 4.31 |
| Net Debt / Assets ⓘ | -13.32% | 38.42% |
| EBITDA / Interest ⓘ | 15.90 | 4.58 |
| Operating Margin (Latest) ⓘ | 90.71% | 20.83% |
| Operating Margin (5Y Median) ⓘ | 116.46% | 20.08% |
| Debt to Equity (Latest) ⓘ | 2.69% | 137.69% |
| Profit Margin (Latest) ⓘ | 2496.23% | 11.37% |
| Free Cash Flow (Latest) ⓘ | $6.40B | |
Momentum (Price trend) | ||
| 3Y Return ⓘ | +90.15% | +52.37% |
| 12M Return (excl. last month) ⓘ | +20.36% | +8.84% |
| 6M Return ⓘ | +2.00% | -3.95% |
| Price vs. 200-Day MA ⓘ | +24.43% | -0.79% |
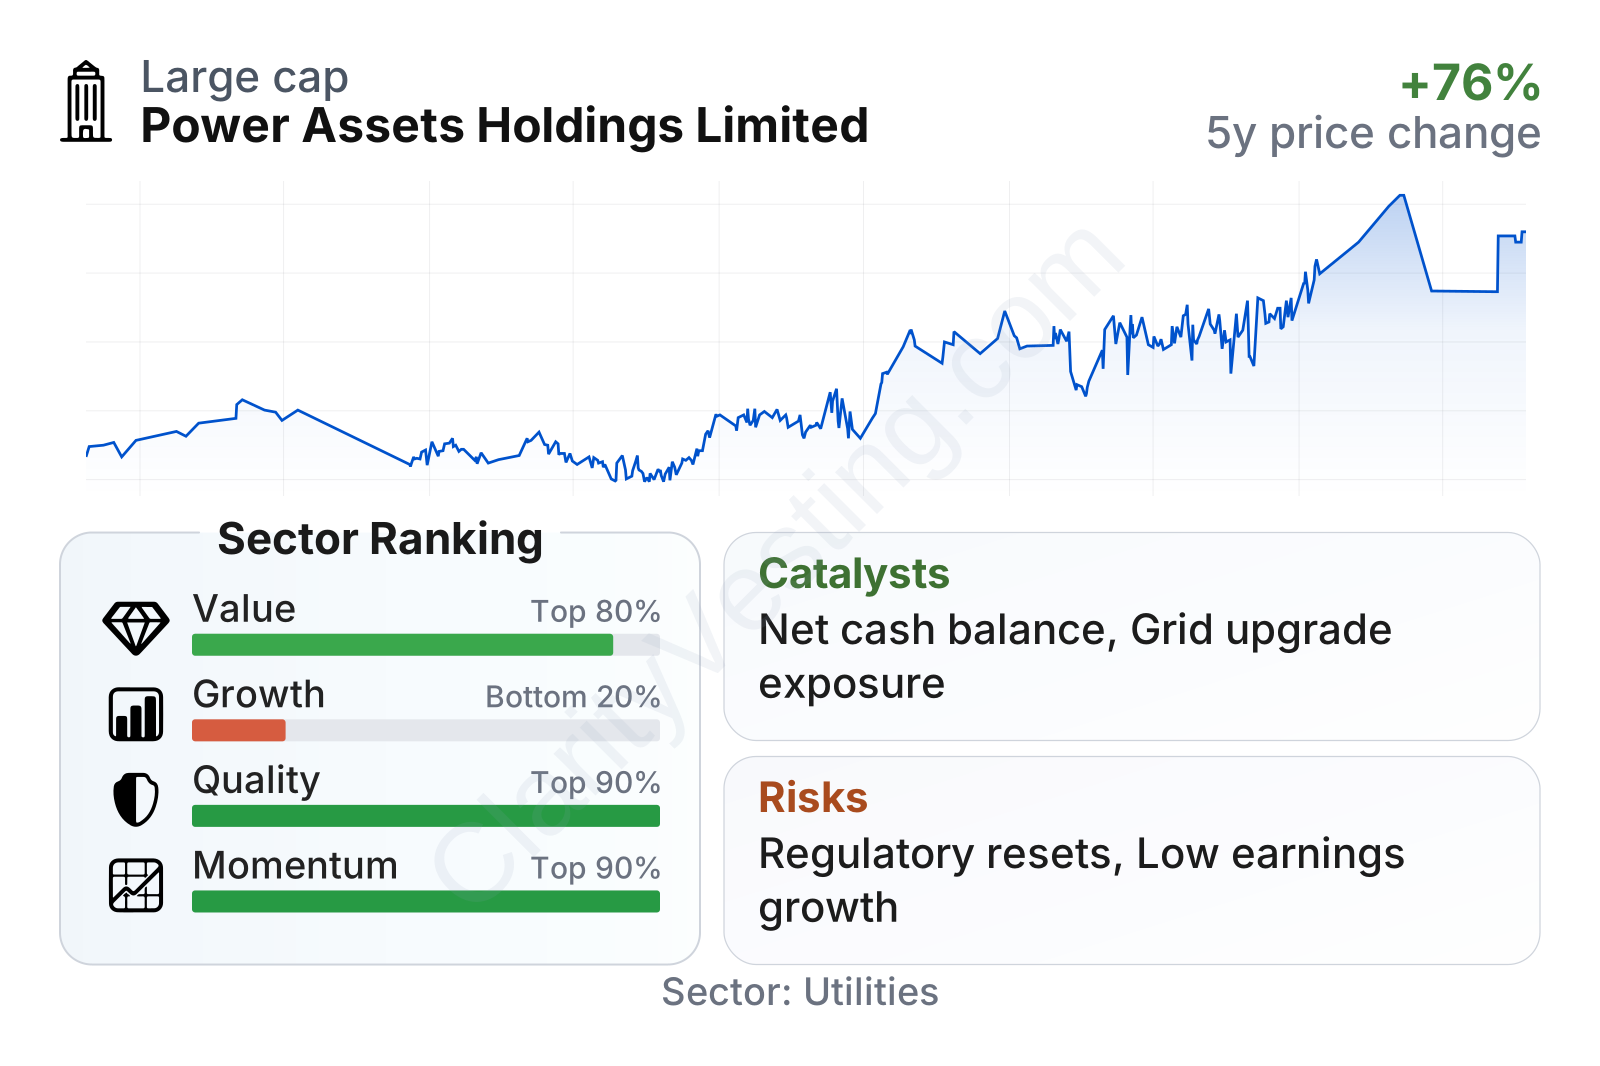
Power Assets stands out for balance-sheet strength and profitability. Quality measures are near the top of the utility peer group, supported by very low leverage, strong interest coverage, and unusually high margins. Value metrics also look strikingly low compared with the sector, with the shares trading at a much lower earnings multiple and book multiple than typical utilities. The weaker area is growth: recent year-over-year revenue declined, earnings growth over five years has been negative, and book value growth has been modest. In other words, this is a financially solid utility group with slow underlying expansion rather than a rapid grower.
Growth
Power Assets operates in a sector that remains relevant for decades: electricity and gas infrastructure. Demand for reliable power networks should continue to be supported by electrification, grid upgrades, renewable integration, data center load growth, and the need to modernize aging infrastructure in developed markets. That does not automatically create fast growth, but it does support the long life and strategic value of the company’s assets.
The company’s strategy has generally been to favor mature, cash-generating infrastructure over aggressive expansion. For long-term analysis, that approach makes sense if management can keep recycling capital into regulated assets with stable returns. It is a conservative model: less explosive upside than developers focused on new projects, but also less exposure to construction risk and commodity swings.
Revenue per share improved sharply after 2023 and has remained at a much higher level. That points to a portfolio mix that is generating more top-line contribution per share than in the earlier period, although it has not translated into equally strong earnings growth. The main question for future expansion is therefore not whether the company can grow reported revenue, but whether it can convert new investments into sustained profit growth.
A practical catalyst is the group’s financial flexibility. With net cash characteristics and strong free cash flow, Power Assets has room to pursue acquisitions or increase exposure to regulated utility assets when opportunities appear. In a sector where many rivals carry heavy debt, a stronger balance sheet can become an advantage when asset prices become more attractive or when financing conditions tighten.
Another potential catalyst is the long-term push to strengthen power networks in markets such as the United Kingdom and Australia. Grid reinforcement, decarbonization, and reliability spending can expand regulated asset bases over time, which may support future returns for infrastructure owners already positioned in those regions.
Risks
This article is for informational purposes only and does not constitute financial advice. Some content is AI-generated. See Disclaimer


