Stock Analysis · Heritage Financial Corporation (HFWA)
Overview
Heritage Financial Corporation is a regional bank holding company based in the Pacific Northwest. Through Heritage Bank, it provides traditional banking services to consumers, small and midsize businesses, and commercial real estate customers, mainly in Washington and Oregon, with some presence in Idaho and California. In simple terms, the company gathers deposits from customers, makes loans, earns interest on those loans and securities, and also collects fees for banking-related services.
For a bank like Heritage, revenue is usually best understood through net interest income and noninterest income. Based on recent annual results, the business is heavily driven by spread income from lending and investing activities, while fees remain a smaller but still useful contributor.
- Net interest income: about 79% of total revenue in 2025. This is the difference between what Heritage earns on loans and securities and what it pays on deposits and other funding. It is the core engine of the business.
- Noninterest income: about 21% of total revenue in 2025. This typically includes service charges on deposit accounts, loan-related fees, card and treasury management income, mortgage banking revenue, and gains or losses tied to investment securities or other assets.
Within the loan book, commercial real estate, commercial business lending, and residential real estate are the main earning assets, while deposits are the key funding source. That structure makes Heritage a fairly classic community and regional bank rather than a specialized lender or national-scale financial institution.
The business mix also shows a useful recent shift: total revenue has grown over the last several years, but profitability was pressured in 2023 and 2024 as funding costs rose sharply. In 2025, earnings improved as that pressure started to ease, suggesting the bank is still working through the higher-rate environment rather than facing a broken business model.
Revenue has trended upward, but a larger share has recently been absorbed by interest expense and operating costs than earlier in the cycle. The encouraging sign is that 2025 showed recovery in earnings after a weak 2024, which points to improving spread economics rather than pure balance-sheet expansion.
Key Figures
| Metric | Value | Sector ⓘ |
|---|---|---|
| Date | Oct 17, 2026 | |
| Context | ||
| Sector | Financial Services | |
| Industry | Banks - Regional | |
| Market Cap ⓘ | $1.10B | |
| Beta ⓘ | 0.50 | |
Value (Cheapness) | ||
| P/E Ratio ⓘ | 12.92 | 12.26 |
| P/B Ratio ⓘ | 1.00 | 1.23 |
| FCF Yield ⓘ | 7.61% | 10.40% |
| Dividend Yield ⓘ | 3.54% | 3.02% |
| EBIT / EV ⓘ | 4.35% | 8.14% |
| PEG ⓘ | 2.12 | |
Growth (Business expansion) | ||
| Revenue Growth ⓘ | 53.10% | 9.35% |
| RPS Growth (5Y CAGR) ⓘ | 9.15% | 12.19% |
| EPS Growth (5Y CAGR) ⓘ | -16.79% | -9.53% |
| BVPS Growth (5Y CAGR) ⓘ | -39.95% | 4.99% |
| Margin Growth (5Y Trend) ⓘ | -25.55% | -3.86% |
| FCF Growth (5Y CAGR) ⓘ | 6.53% | 4.81% |
| DPS Growth (5Y CAGR) ⓘ | 4.22% | 8.79% |
Quality (Business durability) | ||
| ROIC (Latest) ⓘ | 3.63% | 9.49% |
| ROE (Latest) ⓘ | 7.74% | 13.90% |
| ROA (Latest) ⓘ | 1.01% | 1.55% |
| ROIC (5Y Median) ⓘ | 7.29% | 7.86% |
| ROE (5Y Median) ⓘ | 1.58% | 12.17% |
| ROA (5Y Median) ⓘ | 0.96% | 1.30% |
| Net Debt / EBIT (Latest) ⓘ | 1.83 | 0.96 |
| Net Debt / EBIT (5Y Median) ⓘ | -0.13 | 0.73 |
| Net Debt / EBITDA (Latest) ⓘ | 1.70 | 0.92 |
| Operating Margin (Latest) ⓘ | 14.03% | 22.30% |
| Operating Margin (5Y Median) ⓘ | 24.05% | 24.63% |
| Debt to Equity (Latest) ⓘ | 17.01% | 58.56% |
| Profit Margin (Latest) ⓘ | 26.40% | 26.57% |
| Free Cash Flow (Latest) ⓘ | $83.72M | |
Momentum (Price trend) | ||
| 3Y Return ⓘ | +88.38% | +88.33% |
| 12M Return (excl. last month) ⓘ | +22.05% | +19.38% |
| 6M Return ⓘ | +2.99% | +4.75% |
| Price vs. 200-Day MA ⓘ | +0.53% | +3.50% |
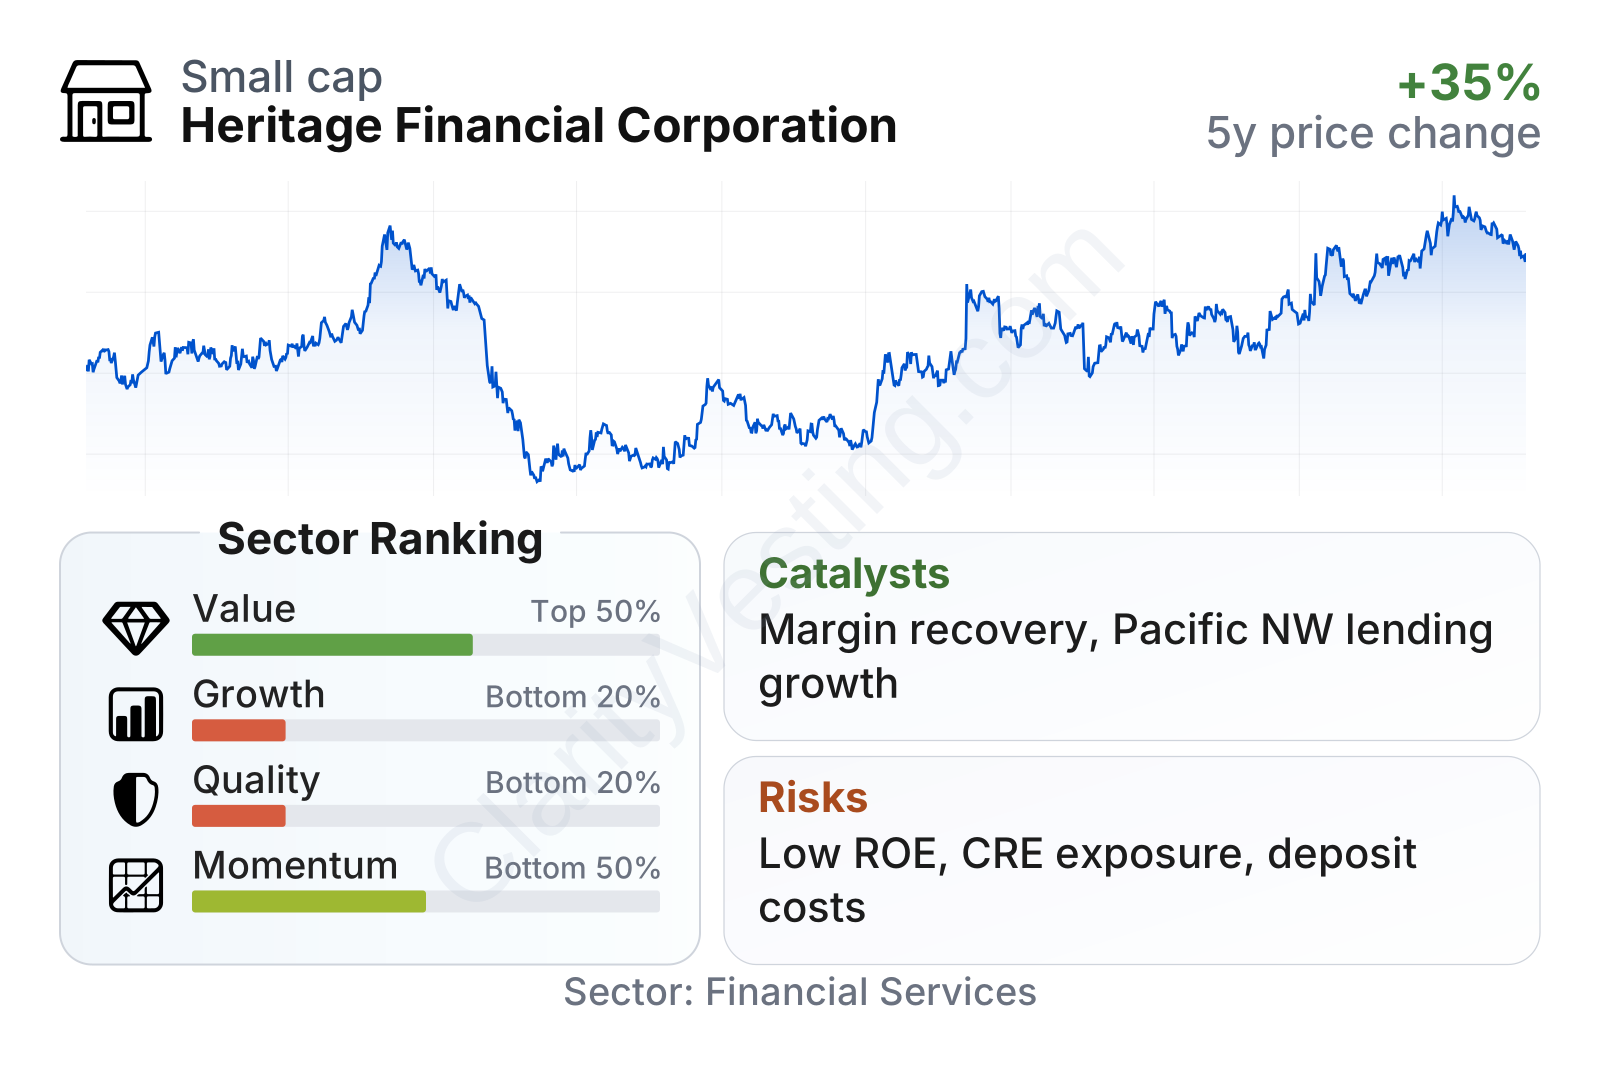
Heritage is a small-cap regional bank with a relatively low beta, meaning its share price has historically moved less than the broader market. On valuation, it sits near the sector median on earnings but below the sector median on book value, while the dividend yield is somewhat higher than the peer median. The weaker areas are quality and growth rankings, where profitability and multi-year compounding have lagged many regional bank peers even though recent revenue growth has been strong.
The stock chart reflects the broader regional bank turbulence of 2023, followed by a meaningful recovery into 2026. Even after that rebound, the valuation still appears more restrained on book value than many peers, which suggests the market continues to weigh the bank’s lower profitability against its improved operating momentum.
Growth
Heritage operates in a sector that is mature rather than fast-growing, so long-term progress usually depends less on disruption and more on disciplined execution: gathering low-cost deposits, underwriting loans carefully, controlling credit losses, and expanding in attractive local markets. The Pacific Northwest remains a reasonable banking market because of business formation, population stability, and small-business activity, but this is not a sector where growth typically comes in dramatic leaps.
Management’s strategy has centered on community banking, commercial lending, and relationship-based deposit gathering. That approach makes sense for a regional bank of this size. It does not require Heritage to outspend national banks on technology or compete nationally on scale. Instead, it relies on local market knowledge and customer relationships, especially with businesses and real estate operators.
Earnings per share show why the growth case needs nuance. Profitability fell from the strong 2021 level through 2024, then rebounded in 2025. That pattern suggests Heritage is not in a smooth compounding phase; it is in a recovery phase. The improvement matters, because it shows the bank can regain earnings power when deposit costs stabilize and spreads improve, but the earlier drop also shows sensitivity to the interest-rate cycle.
Book value per share has also recovered after disruption around 2023. For banks, book value is an important anchor because it represents the capital base that supports lending and absorbs shocks. A rising book value after a difficult period is usually a sign that earnings retention and balance-sheet stability are moving in the right direction.
A practical catalyst for future growth is margin normalization. If funding costs stop rising faster than asset yields, net interest income can improve without requiring aggressive loan growth. Another catalyst is continued expansion in commercial and small-business relationships across its footprint, where local banks can still compete effectively. Recent company updates in 2026 also point to continued profitability improvement and capital strength rather than stress, which supports the idea that Heritage is emerging from the tougher part of the rate cycle.
Risks
This article is for informational purposes only and does not constitute financial advice. Some content is AI-generated. See Disclaimer


