Stock Analysis · Hawaiian Electric Industries Inc (HE)
Overview
Hawaiian Electric Industries Inc. is the parent company of Hawaiian Electric Company, a regulated electric utility serving most of Hawaii, and American Savings Bank, a Hawaii-based financial institution. In practice, this means the group combines a local monopoly-style power business with a regional banking operation. The utility side serves residential, commercial, and government customers across Oahu, Maui County, and Hawaii Island, while the bank provides deposits, mortgages, consumer loans, and commercial banking services.
Its revenue mix is still dominated by the electric utility business, but the group’s earnings profile is influenced by both segments. Based on recent company reporting, the main sources of revenue are approximately:
- Electric utility operations: about 85% to 90% of total revenue. This includes sales of electricity to customers and various regulated bill components that pass through fuel and purchased power costs.
- Banking and other operations: about 10% to 15% of total revenue. This mainly incorporates net interest income, fees, and other banking-related income from American Savings Bank.
For long-term analysis, the most important point is that HE is not a pure-play utility. The utility business drives the group’s strategic importance, but the bank adds diversification, capital requirements, and a second set of risks and opportunities.
The recent financial flow has been unusually volatile. Revenue stayed around the low-$3 billion range in recent years, but profitability was severely disrupted in 2024 before partially recovering in 2025. That pattern matters because it shows that HE’s underlying business remains operating, yet exceptional charges and crisis-related impacts have materially changed the financial picture.
The operating picture looks far less stable than a typical regulated utility. Revenue has held up better than profits, while interest costs have risen and 2024 stands out as a major break in the company’s historical earnings pattern.
Key Figures
| Metric | Value | Sector ⓘ |
|---|---|---|
| Date | Oct 17, 2026 | |
| Context | ||
| Sector | Utilities | |
| Industry | Utilities - Regulated Electric | |
| Market Cap ⓘ | $1.48B | |
| Beta ⓘ | 0.50 | |
Value (Cheapness) | ||
| P/E Ratio ⓘ | 6.56 | 17.28 |
| P/B Ratio ⓘ | 0.83 | 1.51 |
| FCF Yield ⓘ | -38.32% | 0.65% |
| Dividend Yield ⓘ | N/A | 3.77% |
| EBIT / EV ⓘ | 10.32% | 5.01% |
| PEG ⓘ | 5.54 | |
Growth (Business expansion) | ||
| Revenue Growth ⓘ | 25.90% | 6.10% |
| RPS Growth (5Y CAGR) ⓘ | -8.99% | 3.87% |
| EPS Growth (5Y CAGR) ⓘ | -40.72% | -11.30% |
| BVPS Growth (5Y CAGR) ⓘ | -19.53% | 4.23% |
| Margin Growth (5Y Trend) ⓘ | -4.70% | 3.57% |
| FCF Growth (5Y CAGR) ⓘ | -4.97% | -8.84% |
| DPS Growth (5Y CAGR) ⓘ | -70.14% | 4.84% |
Quality (Business durability) | ||
| ROIC (Latest) ⓘ | 8.15% | 6.53% |
| ROA (Latest) ⓘ | 2.63% | 3.20% |
| ROIC (5Y Median) ⓘ | 4.43% | 5.95% |
| ROA (5Y Median) ⓘ | 1.41% | 2.75% |
| Net Debt / EBIT (Latest) ⓘ | 6.01 | 7.13 |
| Net Debt / EBIT (5Y Median) ⓘ | 8.89 | 7.23 |
| Net Debt / EBITDA (Latest) ⓘ | 3.64 | 4.31 |
| Net Debt / Assets ⓘ | 30.68% | 38.42% |
| EBITDA / Interest ⓘ | 5.36 | 4.58 |
| Operating Margin (Latest) ⓘ | 13.07% | 20.83% |
| Operating Margin (5Y Median) ⓘ | 8.49% | 20.08% |
| Debt to Equity (Latest) ⓘ | 159.78% | 137.69% |
| Profit Margin (Latest) ⓘ | 6.82% | 11.37% |
| Free Cash Flow (Latest) ⓘ | -$565.51M | |
Momentum (Price trend) | ||
| 3Y Return ⓘ | -31.30% | +52.37% |
| 12M Return (excl. last month) ⓘ | -14.38% | +8.84% |
| 6M Return ⓘ | -44.66% | -3.95% |
| Price vs. 200-Day MA ⓘ | -37.06% | -0.79% |
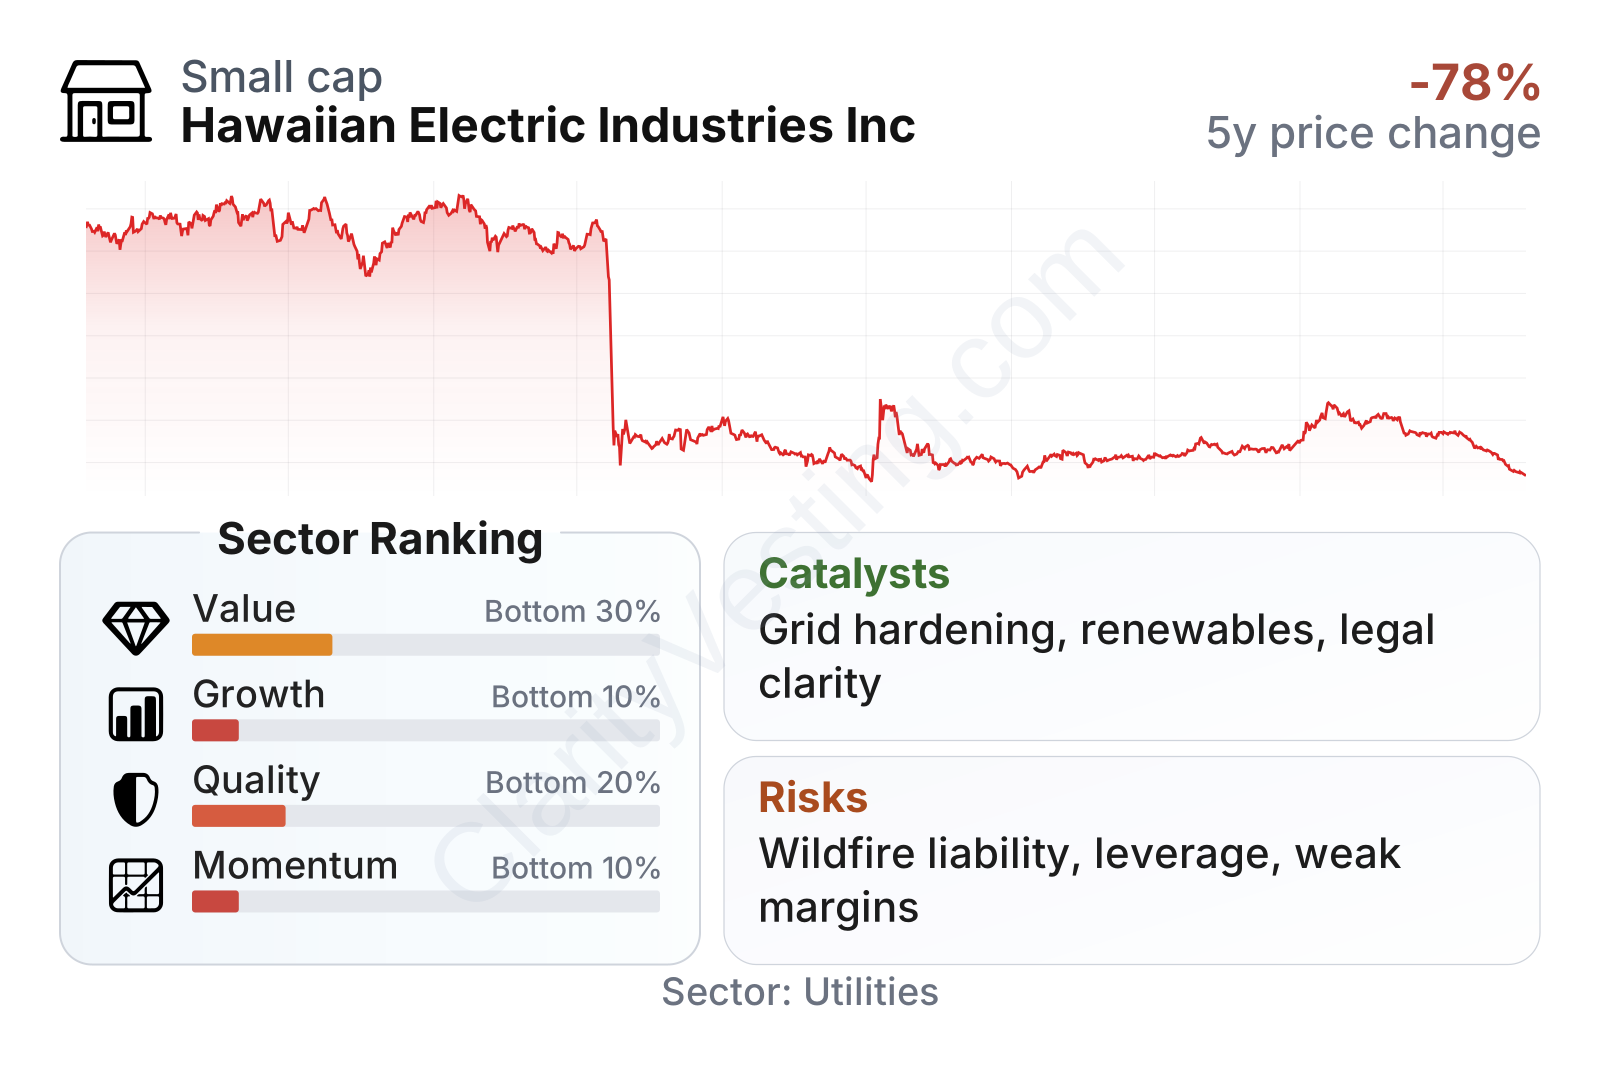
HE is a small-cap regulated utility by sector standards, with relatively low share-price volatility as shown by its beta below 1. On valuation multiples, it screens cheaper than the sector median on both earnings and book value, but that discount comes with weaker growth, weaker quality rankings, and very poor recent market momentum. In other words, the low multiples are tied to elevated uncertainty rather than to a straightforward bargain profile.
The factor breakdown is especially telling. Value metrics look optically inexpensive, but growth ranks near the bottom of the sector, and quality is also below average because margins, returns on assets, and cash generation remain under pressure. Balance-sheet leverage is not the worst in the sector, yet it is still high enough to matter in a capital-intensive business.
Growth
Electric utilities are usually considered a slow-growth sector, but they can still expand steadily when population, grid investment, and renewable-energy spending support a larger regulated asset base. Hawaii’s long-term direction is favorable on that front. The state has ambitious clean-energy goals, and moving an island grid away from imported fossil fuels toward renewables, storage, and resiliency projects creates a long runway for capital investment.
HE’s strategy broadly fits that need. The utility is central to Hawaii’s energy transition, including grid modernization, wildfire mitigation work, and integration of more renewable generation and storage. In a regulated framework, these investments can support future earnings if regulators allow the company to earn a return on the capital it deploys. That is the main long-term growth mechanism for most electric utilities, and HE is no exception.
Even so, the historical record has been weak. Revenue per share has trended down over the last several years, which means growth has not translated cleanly to each share of stock. That partly reflects the extraordinary disruption after the Maui wildfires and partly shows that HE has not delivered the steady per-share expansion investors often expect from a traditional regulated utility.
Cash generation has also been inconsistent. Free cash flow has been modest and at times negative on a broader trailing basis, which is common in utilities during heavy investment cycles, but it still limits financial flexibility. For HE, future growth depends less on near-term free cash flow and more on whether it can keep funding grid upgrades and resiliency projects without further straining the balance sheet.
A significant recent opportunity comes from the company’s efforts to stabilize the business after the wildfire crisis and continue essential infrastructure spending. If HE can restore a more normal regulatory and financial footing, the combination of electric grid hardening, renewable integration, and recovery-related investment could become a meaningful earnings catalyst over time. The banking arm is less likely to drive the overall narrative, but it does provide an additional income stream that can help support consolidated results when the utility business is under pressure.
Risks
This article is for informational purposes only and does not constitute financial advice. Some content is AI-generated. See Disclaimer


