Stock Analysis · Hayward Holdings Inc (HAYW)
Overview
Hayward Holdings Inc designs and sells equipment used mainly in residential swimming pools, with additional exposure to commercial pools and adjacent outdoor-living applications. Its products help move, heat, sanitize, clean, and automate water systems. In simple terms, Hayward is a picks-and-shovels supplier to the pool industry: when a pool is built, renovated, or maintained, many of the key mechanical and electronic parts can come from Hayward.
The business is centered on the aftermarket, which matters because existing pools need recurring replacement parts and upgrades over time. That tends to make demand steadier than a business tied only to new pool construction. The company also emphasizes energy-efficient and connected products, such as variable-speed pumps, heaters, water treatment systems, and automation controls, which can support higher-value sales.
Based on company disclosures, Hayward’s revenue mix is organized primarily by end market and geography.
- Residential pool products: approximately 80% to 85% of revenue. This includes pumps, filters, heaters, cleaners, sanitization systems, lighting, controls, and replacement parts for in-ground and above-ground pools.
- Commercial pool products: approximately 10% to 15% of revenue. This includes equipment for hotels, schools, municipal facilities, and other large aquatic venues.
- Flow control and other applications: approximately 3% to 7% of revenue. This area is smaller and includes certain industrial and outdoor-living related applications.
Geographically, Hayward is still predominantly exposed to North America, which appears to account for roughly 80% to 85% of sales, with Europe and the rest of the world making up the balance. That concentration gives the company strong exposure to the large U.S. installed base of pools, but it also means performance is tied closely to North American housing, weather, and consumer spending patterns.
The financial flow over the last several years shows a business that went through a sharp post-pandemic correction in 2022 and 2023, then began rebuilding revenue and earnings in 2024 and 2025. Gross profit remained comparatively resilient, and operating income recovered as volumes improved and financing costs eased somewhat, although revenue has not yet returned to its 2021 peak.
Key Figures
| Metric | Value | Sector ⓘ |
|---|---|---|
| Date | Oct 03, 2026 | |
| Context | ||
| Sector | Industrials | |
| Industry | Electrical Equipment & Parts | |
| Market Cap ⓘ | $2.62B | |
| Beta ⓘ | 1.10 | |
Value (Cheapness) | ||
| P/E Ratio ⓘ | 17.38 | 22.45 |
| P/B Ratio ⓘ | 1.69 | 1.98 |
| FCF Yield ⓘ | 7.80% | 6.31% |
| Dividend Yield ⓘ | N/A | 1.96% |
| EBIT / EV ⓘ | 8.06% | 4.81% |
| PEG ⓘ | 1.11 | |
Growth (Business expansion) | ||
| Revenue Growth ⓘ | 6.30% | 9.10% |
| RPS Growth (5Y CAGR) ⓘ | -7.80% | 7.75% |
| EPS Growth (5Y CAGR) ⓘ | -21.36% | -13.59% |
| BVPS Growth (5Y CAGR) ⓘ | 1.22% | 6.22% |
| Margin Growth (5Y Trend) ⓘ | 0.08% | 0.72% |
| FCF Growth (5Y CAGR) ⓘ | 8.88% | 10.98% |
| DPS Growth (5Y CAGR) ⓘ | N/A | 9.48% |
Quality (Business durability) | ||
| ROIC (Latest) ⓘ | 8.28% | 10.92% |
| ROA (Latest) ⓘ | 5.25% | 5.41% |
| ROIC (5Y Median) ⓘ | 8.13% | 9.21% |
| ROA (5Y Median) ⓘ | 4.94% | 4.94% |
| Net Debt / EBIT (Latest) ⓘ | -1.14 | 2.07 |
| Net Debt / EBIT (5Y Median) ⓘ | 3.49 | 2.28 |
| Net Debt / EBITDA (Latest) ⓘ | -0.96 | 1.43 |
| Net Debt / Assets ⓘ | -9.41% | 19.27% |
| EBITDA / Interest ⓘ | 5.01 | 9.53 |
| Operating Margin (Latest) ⓘ | 21.99% | 10.50% |
| Operating Margin (5Y Median) ⓘ | 21.71% | 10.27% |
| Debt to Equity (Latest) ⓘ | 0.67% | 65.48% |
| Profit Margin (Latest) ⓘ | 13.83% | 6.62% |
| Free Cash Flow (Latest) ⓘ | $204.26M | |
Momentum (Price trend) | ||
| 3Y Return ⓘ | -13.19% | +58.56% |
| 12M Return (excl. last month) ⓘ | -12.62% | +15.63% |
| 6M Return ⓘ | -8.52% | +4.19% |
| Price vs. 200-Day MA ⓘ | -18.03% | +0.93% |
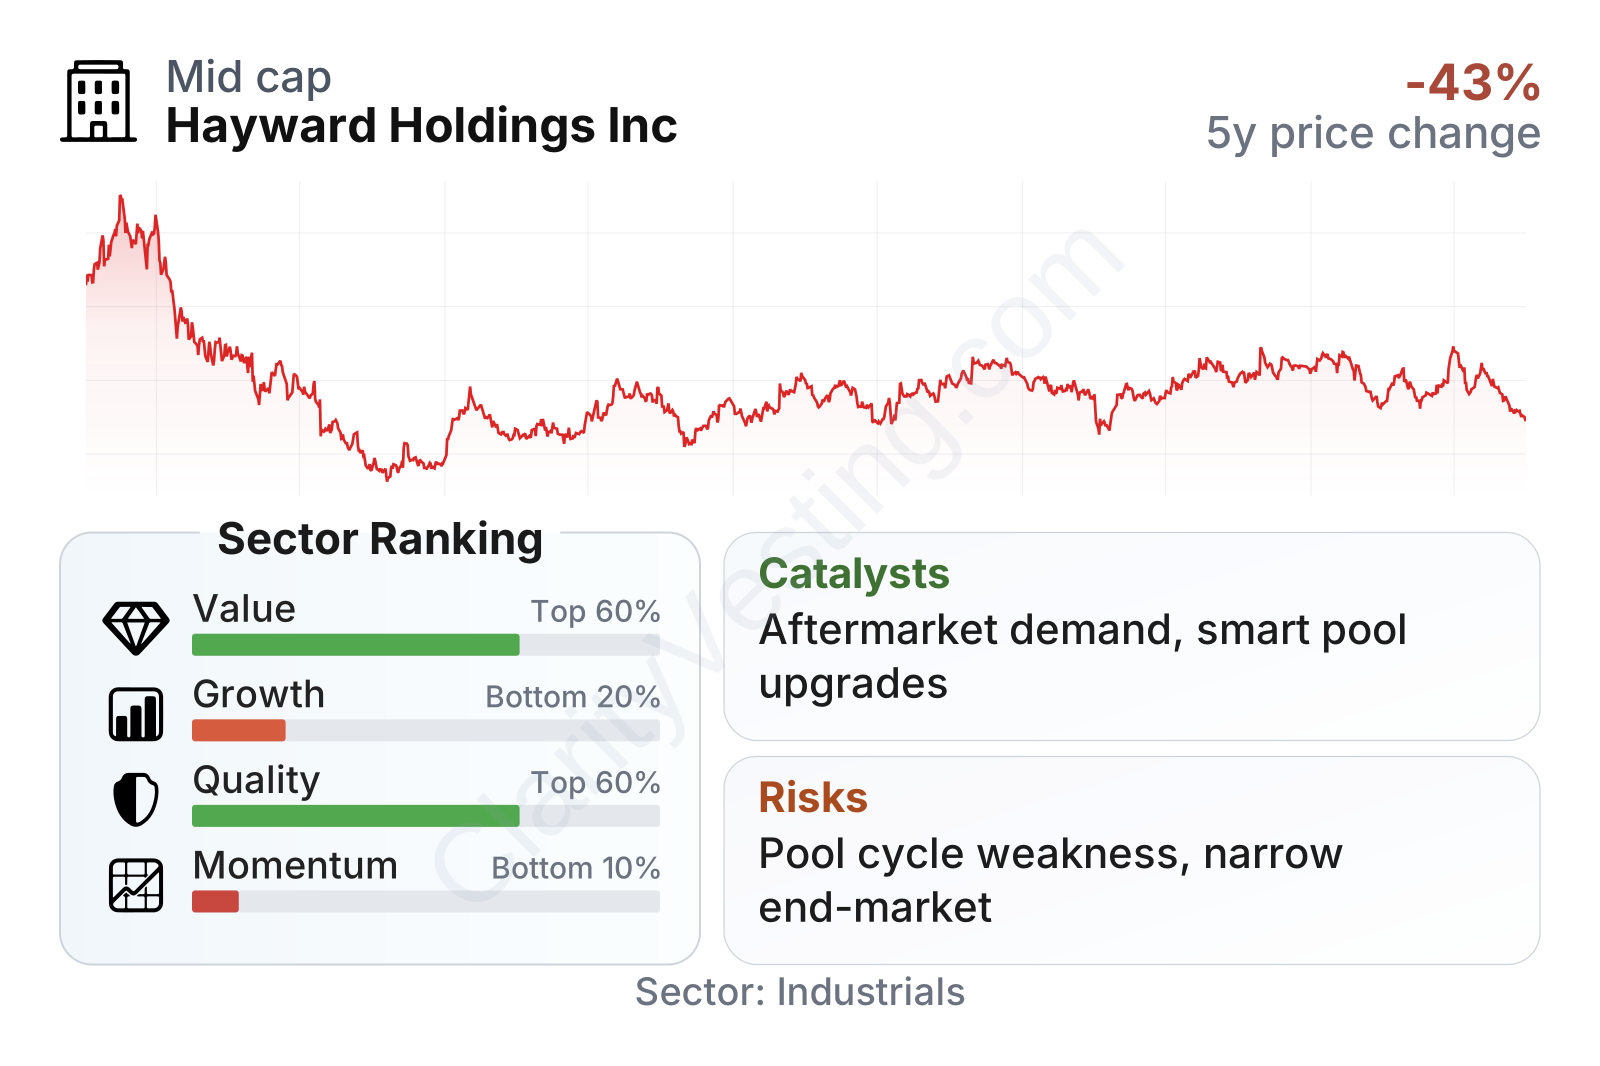
Hayward is a mid-sized industrial company with share-price behavior that has been more volatile than the broad market, but not dramatically so. The most notable feature in the current profile is the contrast between solid profitability and cash generation versus weaker long-term growth and poor recent stock momentum. Relative to its sector, the company screens better on valuation and margins than on expansion.
The factor breakdown also suggests a business that has become financially cleaner. Profitability is comfortably above the sector median, free cash flow generation is healthy, and leverage is currently very low. At the same time, the market has remained cautious, likely because revenue growth has been uneven since the industry slowdown after the pandemic demand surge.
Growth
Hayward operates in an industry with attractive long-term characteristics, even if year-to-year results can be cyclical. The installed base of swimming pools creates recurring demand for replacement equipment, maintenance parts, and upgrades. That is a favorable setup because a pool owner may postpone a full remodel, but pumps, filters, heaters, cleaners, and control systems still wear out and need to be replaced. This creates a recurring revenue engine that is less fragile than a purely construction-driven business.
The company’s strategy also fits where the market is moving. Newer pool equipment increasingly focuses on energy efficiency, water savings, automation, and connected controls. Variable-speed pumps, smart control systems, and modern water treatment products can offer both regulatory and consumer benefits. Those categories are important because they can support premium pricing and replacement demand even in slower construction markets.
Recent revenue trends show that Hayward has moved beyond the steep contraction seen in 2022 and 2023. Growth turned positive again in late 2023, improved through 2024, and remained positive into the first half of 2026. The pace is not especially fast compared with the broader sector, but the direction has become more constructive.
Cash generation adds another growth-supporting element. Free cash flow has been uneven, which is normal in a seasonal and inventory-sensitive business, but the company has shown an ability to produce meaningful cash over time. That gives management room to invest in product development, support channel inventory, reduce debt, and pursue selective capital allocation options without putting the balance sheet under obvious pressure.
A meaningful catalyst is the normalization of pool-industry demand after distributor inventory corrections. In recent years, many companies tied to the pool market had to work through excess inventory after the pandemic-era surge faded. As inventories normalize, underlying replacement demand becomes easier to see. Another potential opportunity is continued adoption of automation and energy-efficient products, which can raise revenue per pool even if the number of new pools grows more slowly.
Recent company updates and filings also point to ongoing product launches and channel execution efforts rather than a major strategic reset. That is usually a sign that management sees the current period as a recovery and share-gain phase, not a business model problem.
Risks
This article is for informational purposes only and does not constitute financial advice. Some content is AI-generated. See Disclaimer