Stock Analysis · Haw Par Corporation Ltd (HAWPY)
Overview
Haw Par Corporation Ltd is a Singapore-based consumer healthcare group best known for Tiger Balm, one of the most widely recognized topical pain relief brands in Asia and many export markets. Although it is classified in healthcare, Haw Par is not a large research-driven pharmaceutical company. Its core business is the manufacture, marketing, and sale of over-the-counter healthcare products, especially analgesic balms, patches, rubs, and related wellness items.
The business mix is unusual because reported earnings are influenced not only by product sales but also by investment income. In practice, the company combines a branded consumer health franchise with a substantial investment portfolio and some smaller legacy assets.
Based on recent annual reporting, Haw Par’s main sources of revenue appear to be:
- Healthcare products: about 90%+ of group revenue. This includes Tiger Balm ointments, plasters, patches, and other over-the-counter products sold through pharmacies, retailers, distributors, and e-commerce channels.
- Leisure and other activities: low single-digit share of revenue. This mainly includes the group’s oceanarium-related and other smaller operating activities.
- Property and investments: limited revenue contribution, but meaningful profit impact. These activities may contribute less to sales than healthcare, yet they can materially affect net income through dividends, fair-value movements, and other non-operating items.
That last point matters: Haw Par can look more profitable than a normal consumer health business because investment gains can boost bottom-line earnings. At the same time, the operating business itself remains attractive, with healthcare revenue having expanded strongly over the past several years before a softer latest year. The broad financial flow also shows a company with healthy gross profitability and relatively controlled operating costs, even if net income has been helped by items outside day-to-day product sales.
Over the last few years, revenue rose from roughly the low-$100 millions to above $200 million, while net income increased even faster. The gap between operating profit and net income suggests that non-operating contributions remain important, which is a central point when judging the business.
Key Figures
| Metric | Value | Sector ⓘ |
|---|---|---|
| Date | Oct 24, 2026 | |
| Context | ||
| Sector | Healthcare | |
| Industry | Drug Manufacturers - General | |
| Market Cap ⓘ | $2.96B | |
| Beta ⓘ | 0.16 | |
Value (Cheapness) | ||
| P/E Ratio ⓘ | 14.58 | 25.42 |
| P/B Ratio ⓘ | 0.62 | 3.08 |
| FCF Yield ⓘ | 9.83% | 3.12% |
| Dividend Yield ⓘ | 2.33% | 1.85% |
| EBIT / EV ⓘ | N/A | 0.56% |
| PEG ⓘ | N/A | |
Growth (Business expansion) | ||
| Revenue Growth ⓘ | -8.20% | 7.50% |
| RPS Growth (5Y CAGR) ⓘ | 12.50% | 8.60% |
| EPS Growth (5Y CAGR) ⓘ | 15.31% | -17.73% |
| BVPS Growth (5Y CAGR) ⓘ | 7.49% | 3.72% |
| Margin Growth (5Y Trend) ⓘ | 11.68% | -0.57% |
| FCF Growth (5Y CAGR) ⓘ | 106.89% | 0.96% |
| DPS Growth (5Y CAGR) ⓘ | 46.39% | 6.69% |
Quality (Business durability) | ||
| ROIC (Latest) ⓘ | 2.85% | 3.17% |
| ROA (Latest) ⓘ | 10.50% | 2.98% |
| ROIC (5Y Median) ⓘ | 1.33% | 4.56% |
| ROA (5Y Median) ⓘ | 5.80% | 1.87% |
| Net Debt / EBIT (Latest) ⓘ | -4.63 | 1.34 |
| Net Debt / EBIT (5Y Median) ⓘ | -8.84 | 1.86 |
| Net Debt / EBITDA (Latest) ⓘ | -4.23 | 1.00 |
| Net Debt / Assets ⓘ | -12.64% | 5.06% |
| EBITDA / Interest ⓘ | N/A | 9.55 |
| Operating Margin (Latest) ⓘ | 28.09% | 9.25% |
| Operating Margin (5Y Median) ⓘ | 27.58% | 7.33% |
| Debt to Equity (Latest) ⓘ | 1.11% | 26.68% |
| Profit Margin (Latest) ⓘ | 104.39% | 3.34% |
| Free Cash Flow (Latest) ⓘ | $290.99M | |
Momentum (Price trend) | ||
| 3Y Return ⓘ | +132.10% | +51.61% |
| 12M Return (excl. last month) ⓘ | +7.82% | +19.90% |
| 6M Return ⓘ | +2.38% | +10.10% |
| Price vs. 200-Day MA ⓘ | +2.82% | +6.44% |
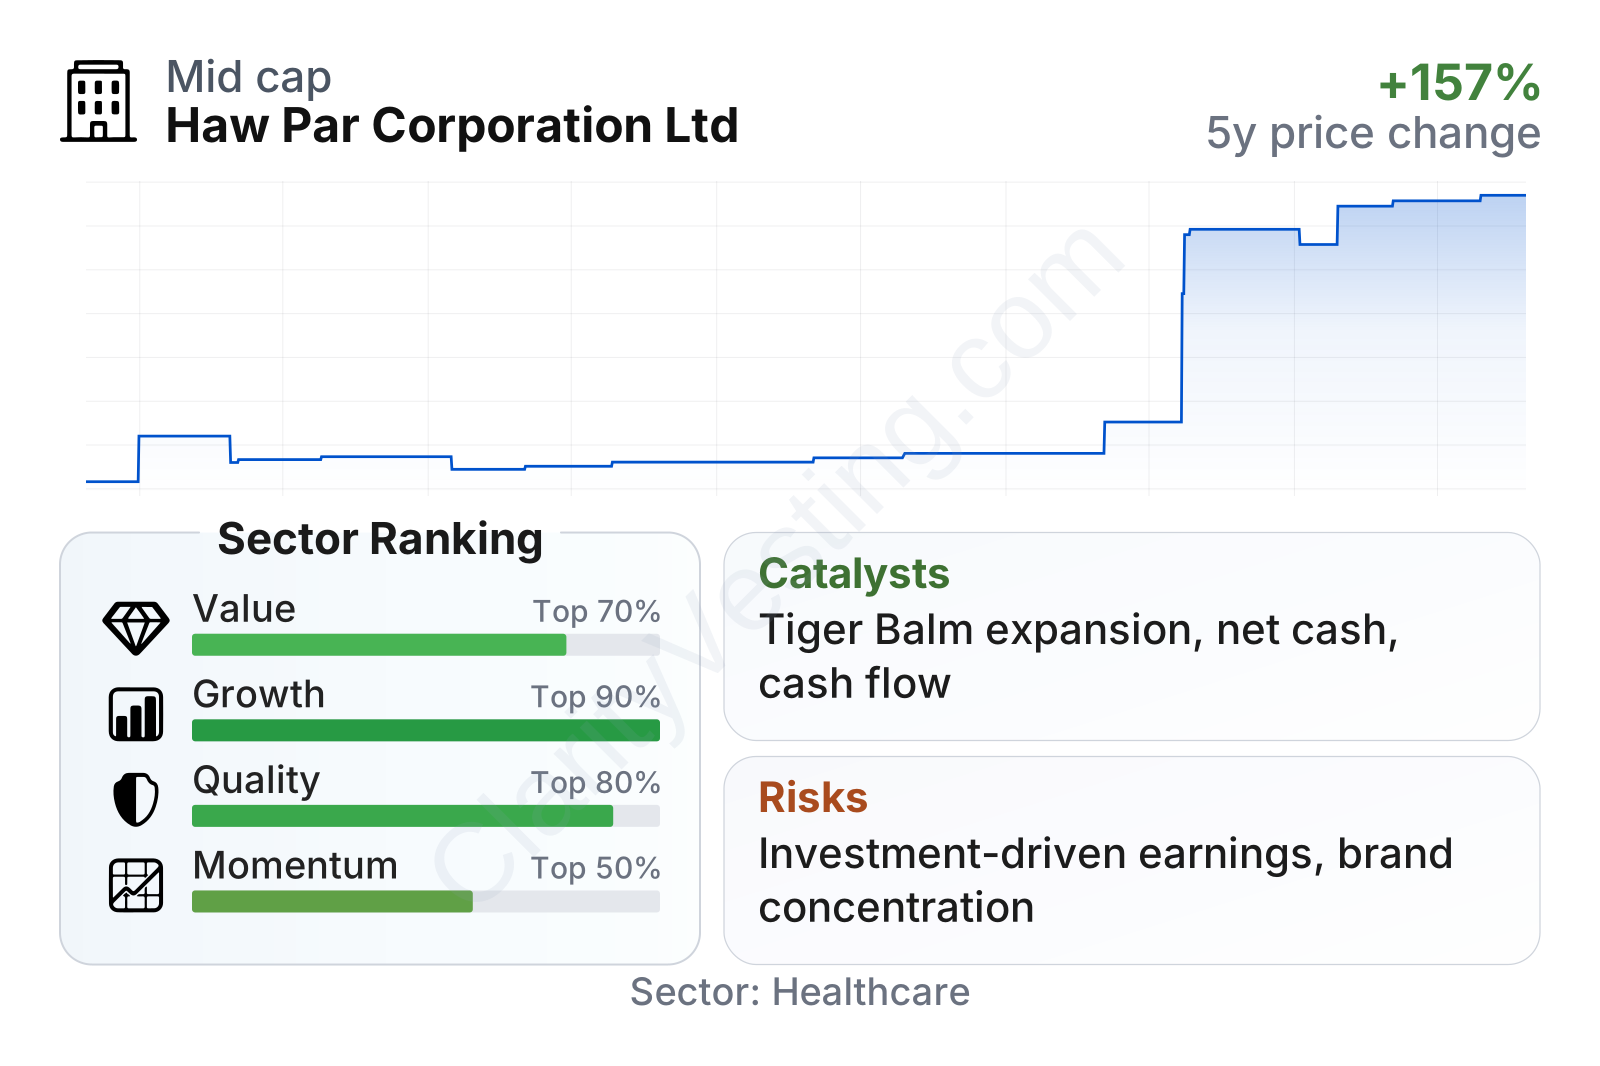
Haw Par stands out as a mid-sized company with an unusually strong balance sheet and high cash generation relative to its size. The valuation metrics sit below the healthcare sector median, while free cash flow yield is notably stronger than many peers. Quality indicators are also solid, especially operating margin, asset profitability, and the absence of meaningful net debt.
Growth metrics need a more careful reading. The latest year shows a revenue decline of about 8%, which weakens the short-term picture, but the longer-term record is much better: five-year revenue per share growth is in the low teens annually and earnings per share growth has been stronger still. Share price performance over three years has been very strong, though the shorter-term trend has cooled after the sharp rerating.
Growth
Haw Par operates in a favorable niche of the healthcare market: branded over-the-counter pain relief and self-care. This part of healthcare tends to benefit from aging populations, rising health awareness, and consumer preference for accessible, non-prescription remedies. Those are supportive structural trends, especially in Asia, where Tiger Balm has long-standing brand recognition, and in international export markets where the brand can still deepen its distribution.
The company’s strategy appears sensible for long-term expansion because it relies on a familiar formula: protect a trusted brand, extend distribution, and build product reach across geographies and channels. This is less dramatic than a biotech pipeline, but also less binary. Growth can come from broader retail penetration, travel retail normalization, e-commerce, product line extensions, and deeper presence in large consumer markets where topical pain relief is already a well-established category.
A major strength is that Haw Par does not need breakthrough scientific innovation to grow. In consumer healthcare, brand recall, shelf space, distributor relationships, and repeat purchases can matter more than cutting-edge R&D. Tiger Balm’s global recognition gives Haw Par a practical advantage that many smaller competitors lack.
One recent positive signal is that the company has continued to show very strong multi-year earnings and free cash flow growth despite a softer latest revenue comparison. That suggests the business has built a more profitable base than it had a few years ago. Another supportive factor is financial flexibility: with net cash rather than heavy leverage, Haw Par has room to invest in marketing, acquisitions, product development, or shareholder distributions without balance sheet pressure.
Still, growth is unlikely to resemble high-growth healthcare names. This is more of a branded consumer health compounding model than a rapid expansion platform. The real catalyst is steady market penetration combined with durable margins and disciplined capital allocation.
Risks
This article is for informational purposes only and does not constitute financial advice. Some content is AI-generated. See Disclaimer


