Stock Analysis · Hannon Armstrong Sustainable Infrastructure Capital Inc (HASI)
Overview
Hannon Armstrong Sustainable Infrastructure Capital Inc. is a specialized financing company focused on climate-related infrastructure. In simple terms, it provides capital to projects and businesses tied to the energy transition, then earns income from the financing and ownership structures attached to those investments. Its activity sits at the intersection of real assets, renewable energy, and structured finance.
The company’s portfolio is mainly tied to assets that reduce carbon emissions or improve resource efficiency. According to its recent company disclosures, the business is centered on three broad areas:
- Behind-the-meter projects: roughly 35% to 45% of the portfolio in recent years. These are assets located on the customer side of the utility meter, such as energy efficiency upgrades, solar systems serving buildings directly, storage, and similar infrastructure.
- Grid-connected renewable energy: roughly 35% to 45%. This includes utility-scale solar, wind, and other clean power assets that sell into the grid.
- Fuels, transport, and nature-based solutions: roughly 10% to 20%. This bucket includes cleaner fuels, transportation-related decarbonization, and certain land or carbon-oriented investments.
Its revenue does not behave like that of a typical industrial company. A large share comes from interest income and other returns on financing receivables, debt securities, and equity-method investments. It also generates income from gain-on-sale and securitization activity, plus recurring cash flows from certain owned assets and managed structures. In practice, this means results can be influenced by both long-term contracted project cash flows and capital markets activity.
The business model is easier to understand if viewed as a climate infrastructure financier rather than a traditional lender. Hannon Armstrong often works with developers, corporate customers, and public-sector counterparties, helping fund projects that may have long lives and contracted revenue. That can create visible cash generation, but it also makes the company sensitive to interest rates, deal volume, and the health of renewable energy markets.
The long-term pattern shows a business that expanded revenue and net income strongly through 2024, followed by a much less clean 2025 profile, with pressure on operating income even as net income remained positive. That is a reminder that reported earnings can move differently from underlying operating trends in this type of financing platform.
Key Figures
| Metric | Value | Sector ⓘ |
|---|---|---|
| Date | Oct 10, 2026 | |
| Context | ||
| Sector | Financial Services | |
| Industry | Asset Management | |
| Market Cap ⓘ | $4.67B | |
| Beta ⓘ | 1.42 | |
Value (Cheapness) | ||
| P/E Ratio ⓘ | 55.92 | 12.38 |
| P/B Ratio ⓘ | 2.14 | 1.23 |
| FCF Yield ⓘ | 4.46% | 10.23% |
| Dividend Yield ⓘ | 4.62% | 3.01% |
| EBIT / EV ⓘ | -0.17% | 8.08% |
| PEG ⓘ | 1.11 | |
Growth (Business expansion) | ||
| Revenue Growth ⓘ | 804.40% | 9.50% |
| RPS Growth (5Y CAGR) ⓘ | -6.99% | 12.21% |
| EPS Growth (5Y CAGR) ⓘ | -8.68% | -9.62% |
| BVPS Growth (5Y CAGR) ⓘ | 0.94% | 4.98% |
| Margin Growth (5Y Trend) ⓘ | -49.34% | -4.07% |
| FCF Growth (5Y CAGR) ⓘ | 88.30% | 4.76% |
| DPS Growth (5Y CAGR) ⓘ | 4.06% | 8.79% |
Quality (Business durability) | ||
| ROIC (Latest) ⓘ | -0.17% | 9.35% |
| ROE (Latest) ⓘ | 3.48% | 13.91% |
| ROA (Latest) ⓘ | 1.00% | 1.53% |
| ROIC (5Y Median) ⓘ | 2.76% | 7.86% |
| ROE (5Y Median) ⓘ | 8.08% | 12.22% |
| ROA (5Y Median) ⓘ | 2.63% | 1.29% |
| Net Debt / EBIT (Latest) ⓘ | N/A | 0.99 |
| Net Debt / EBIT (5Y Median) ⓘ | 15.64 | 0.73 |
| Net Debt / EBITDA (Latest) ⓘ | N/A | 0.93 |
| Operating Margin (Latest) ⓘ | -3.67% | 22.19% |
| Operating Margin (5Y Median) ⓘ | 39.57% | 24.30% |
| Debt to Equity (Latest) ⓘ | 232.13% | 60.24% |
| Profit Margin (Latest) ⓘ | 67.65% | 26.49% |
| Free Cash Flow (Latest) ⓘ | $208.53M | |
Momentum (Price trend) | ||
| 3Y Return ⓘ | +176.48% | +88.52% |
| 12M Return (excl. last month) ⓘ | +48.82% | +19.65% |
| 6M Return ⓘ | -3.54% | +6.00% |
| Price vs. 200-Day MA ⓘ | -1.71% | +3.61% |
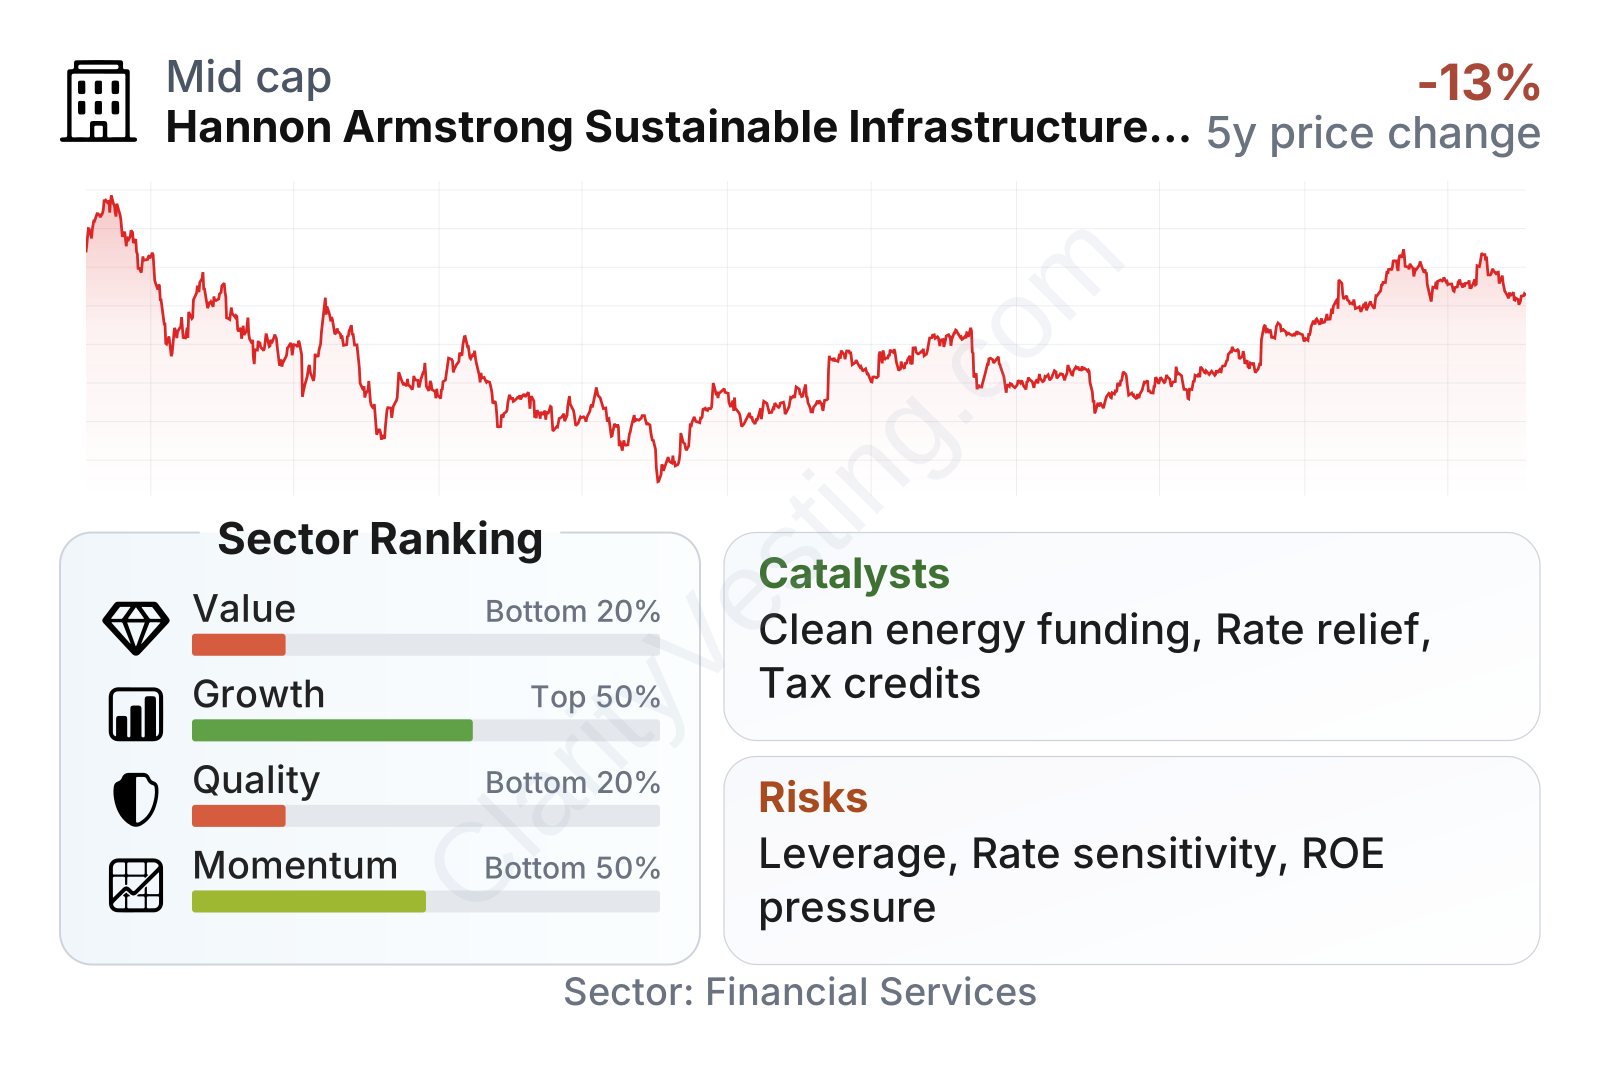
Hannon Armstrong is a mid-sized listed company with a market value in the mid-single-digit billions of dollars. The stock has been volatile over the past several years: it fell sharply during the rate shock of 2022 and 2023, then recovered meaningfully into 2026. That path fits a business whose valuation is closely tied to financing conditions.
The metrics table points to a mixed picture. On valuation, the stock screens as expensive versus the broader financial sector, especially on earnings and book value multiples. On growth, recent revenue growth looks strong, but the longer-term picture is less convincing because per-share revenue and book value growth have been modest and margins have been uneven. On quality, profitability ratios currently sit below sector medians, while leverage remains high relative to many financial peers. On momentum, the longer-term share performance has improved, although the shorter-term trend has cooled after the rebound.
Growth
Hannon Armstrong operates in a part of the market that still has a strong structural tailwind. Electricity demand is rising in many regions, utilities and corporations continue to add renewable generation, and building owners are still looking for efficiency upgrades, distributed energy, and resiliency solutions. Those forces support the need for capital, especially from specialist firms that understand project structures and tax-oriented financing.
The company’s strategy broadly makes sense for that backdrop. It focuses on areas where projects often have contracted cash flows, and where financing can be complex enough to favor a specialist over a generic lender. That specialization matters because renewable and efficiency projects frequently involve tax credits, structured ownership, multi-party contracts, and long asset lives. A platform that knows how to underwrite those details can retain a role even as larger capital pools enter the sector.
Earnings per share moved steadily higher from 2021 through 2025, which suggests the company was able to expand its earning base despite a difficult interest-rate environment. That is encouraging, although investors should remember that financing businesses can show smoother EPS trends than their underlying operating conditions when gains, accounting marks, or portfolio actions help offset pressure elsewhere.
Book value per share has been much less dynamic. It improved through 2023, then slipped in 2024 before a partial recovery. For a capital-intensive finance company, book value is an important anchor because it reflects how effectively management compounds shareholder capital over time. The relatively flat multi-year trend suggests growth has not translated into equally strong balance-sheet compounding.
One meaningful catalyst is the continuing buildout of U.S. clean energy infrastructure. Federal incentives remain an important support for solar, storage, efficiency, and related assets, and that tends to expand the financing opportunity set for firms active in those markets. Another potential catalyst is lower or more stable interest rates, which can improve asset values, reduce funding pressure, and make long-duration cash flow businesses more attractive in public markets.
Recent company communications have also emphasized capital recycling, portfolio management, and funding flexibility. If management can continue originating attractive investments while matching them with efficient long-term funding, that can support future earnings growth without requiring balance-sheet expansion at any cost.
Risks
This article is for informational purposes only and does not constitute financial advice. Some content is AI-generated. See Disclaimer