Stock Analysis · HAL Trust (HALFF)
Overview
HAL Trust is a Netherlands-based investment holding company. Rather than operating one single business, it owns a portfolio of companies and stakes in listed and private assets. Its structure is closer to a long-term owner of businesses than to a traditional asset manager that mainly earns management fees. The group is known for building positions over many years and for keeping a meaningful amount of capital concentrated in a limited number of businesses.
The largest part of HAL Trust’s economic exposure comes from its majority ownership in Broadview Holding, an industrial group active in marine systems and building materials, and from its large listed stake in Vopak, the tank storage company. It also owns or backs businesses in optical retail, staffing, hearing care, orthopedic devices, online platforms, and real estate, while maintaining a portfolio of quoted minority investments.
Based on HAL’s recent annual reporting, the main sources of value and income are broadly concentrated as follows:
- Broadview Holding and other consolidated operating companies: the largest share of reported revenue, likely well above 70% of consolidated sales. This includes industrial and materials activities such as marine technology and building-products-related businesses.
- Vopak: a major source of asset value and earnings contribution through HAL’s large equity stake, although not fully consolidated as ordinary revenue in the same way as majority-owned subsidiaries.
- Quoted minority interests and other private investments: a smaller but important contributor to net asset value changes, dividend receipts, and realized gains. This bucket includes listed stakes and private equity-style holdings.
- Real estate and liquid portfolio assets: a modest share of overall economics, mainly supporting diversification and balance-sheet flexibility.
This mix matters for long-term analysis because HAL Trust’s reported revenue does not tell the full picture on its own. Changes in the value and profitability of investees, capital allocation decisions, asset sales, and listed market movements can have a large effect on book value and net income from one year to another.
The revenue path over the last several years shows a business base that expanded materially from 2021 to 2025, but with uneven profit conversion. Operating income and net income recovered strongly after the 2022 drop, which is consistent with the holding-company model: results can be lumpy, while underlying asset value can still compound over time.
The operating picture improved again in 2024 and 2025, with revenue staying above earlier levels and operating profit moving higher. That suggests the underlying portfolio has retained earnings power even though the group remains exposed to cyclical swings and valuation changes across multiple holdings.
Key Figures
| Metric | Value | Sector ⓘ |
|---|---|---|
| Date | Oct 17, 2026 | |
| Context | ||
| Sector | Financial Services | |
| Industry | Asset Management | |
| Market Cap ⓘ | $16.46B | |
| Beta ⓘ | 0.65 | |
Value (Cheapness) | ||
| P/E Ratio ⓘ | 9.87 | 12.26 |
| P/B Ratio ⓘ | 1.17 | 1.23 |
| FCF Yield ⓘ | 16.95% | 10.40% |
| Dividend Yield ⓘ | 1.92% | 3.02% |
| EBIT / EV ⓘ | N/A | 8.14% |
| PEG ⓘ | N/A | |
Growth (Business expansion) | ||
| Revenue Growth ⓘ | -8.80% | 9.35% |
| RPS Growth (5Y CAGR) ⓘ | 14.96% | 12.19% |
| EPS Growth (5Y CAGR) ⓘ | -41.82% | -9.53% |
| BVPS Growth (5Y CAGR) ⓘ | 2.05% | 4.99% |
| Margin Growth (5Y Trend) ⓘ | 5.85% | -3.86% |
| FCF Growth (5Y CAGR) ⓘ | 22.37% | 4.81% |
| DPS Growth (5Y CAGR) ⓘ | 6.84% | 8.79% |
Quality (Business durability) | ||
| ROIC (Latest) ⓘ | 19.39% | 9.49% |
| ROE (Latest) ⓘ | 23.58% | 13.90% |
| ROA (Latest) ⓘ | 11.21% | 1.55% |
| ROIC (5Y Median) ⓘ | 7.86% | 7.86% |
| ROE (5Y Median) ⓘ | 10.03% | 12.17% |
| ROA (5Y Median) ⓘ | 4.51% | 1.30% |
| Net Debt / EBIT (Latest) ⓘ | 0.08 | 0.96 |
| Net Debt / EBIT (5Y Median) ⓘ | 1.91 | 0.73 |
| Net Debt / EBITDA (Latest) ⓘ | 0.05 | 0.92 |
| Operating Margin (Latest) ⓘ | 16.59% | 22.30% |
| Operating Margin (5Y Median) ⓘ | 14.42% | 24.63% |
| Debt to Equity (Latest) ⓘ | 29.57% | 58.56% |
| Profit Margin (Latest) ⓘ | 11.31% | 26.57% |
| Free Cash Flow (Latest) ⓘ | $2.79B | |
Momentum (Price trend) | ||
| 3Y Return ⓘ | +75.16% | +88.33% |
| 12M Return (excl. last month) ⓘ | +20.80% | +19.38% |
| 6M Return ⓘ | -3.36% | +4.75% |
| Price vs. 200-Day MA ⓘ | +22.80% | +3.50% |
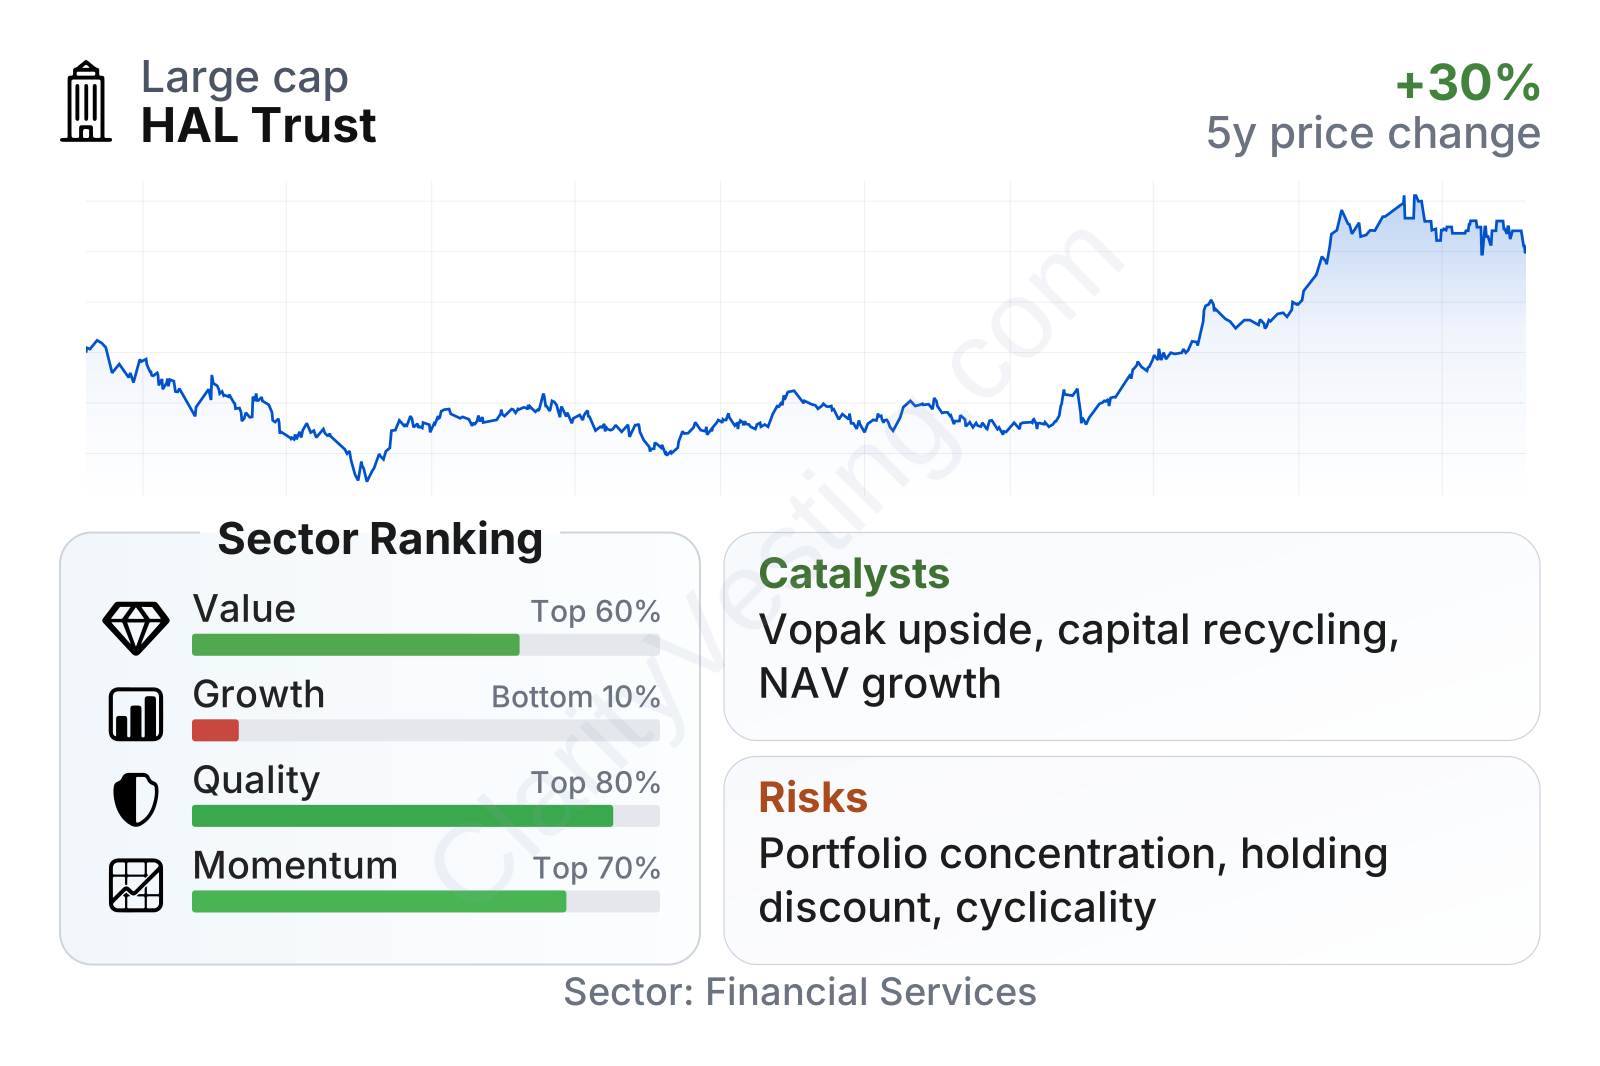
HAL Trust sits in the large-cap range for its niche and has shown relatively low share-price volatility, with a beta around 0.65. On valuation, earnings and book-based multiples are close to or slightly below sector norms on the latest snapshot, while free-cash-flow yield stands above the sector median. Quality metrics are notably strong, especially return on capital, return on equity, and return on assets on a trailing basis. The weaker area is growth: recent revenue declined year over year, and long-term EPS progression has been volatile and below sector norms, reflecting the uneven nature of a diversified holding company.
The stock-price chart shows a strong rebound from the lows of 2022 and 2023, followed by a sharp rise into 2026. That move indicates the market has become more optimistic about the portfolio’s value creation, but it also means some of the discount that often exists in holding companies may already have narrowed.
Growth
HAL Trust is not a direct play on one high-growth industry. Its growth profile depends on the sectors of its portfolio companies and on management’s capital allocation. That said, several of its exposures are in areas with durable long-term demand: energy and chemical logistics through Vopak, marine systems, building products, hearing care, medical devices, staffing, and digital platforms. This creates a diversified path to growth rather than reliance on one single market cycle.
The strategy makes sense for long-duration compounding if management continues to recycle capital well. HAL has a long record of buying, building, and exiting businesses, and this model can create value even when reported earnings are uneven. A useful sign is that free cash flow has grown strongly over the last five years, and operating-margin trend has improved, even though top-line growth has recently slowed.
The missing strength in the recent profile is earnings smoothness. EPS growth over five years has been weak and much more volatile than the sector median. For a holding company, that does not automatically mean deterioration in franchise quality; it often reflects exits, revaluations, and changes in contribution from associates. Still, it does mean that readers should treat short-term earnings as a less reliable measure than the underlying value of the portfolio.
Book value per share has risen over the last few years after the 2022 setback, which is an important signal for a company like HAL. Since the business is essentially a collection of assets and operating subsidiaries, long-term growth in net asset value and book value matters more than a single-year earnings figure. The increase from 2023 through 2025 suggests that portfolio value creation resumed at a healthy pace.
A meaningful catalyst is the company’s ability to monetize mature holdings and redeploy capital into new opportunities. Another is any improvement in the valuation or operating performance of major holdings such as Vopak and Broadview. If the group continues to compound book value while maintaining financial flexibility, that can support further long-term value creation even without rapid consolidated revenue growth.
Recent developments around portfolio reshaping and continuing operational improvement in major holdings point to opportunity, particularly if management can unlock value through disposals, bolt-on acquisitions, or a narrower discount between market price and underlying asset value.
Risks
This article is for informational purposes only and does not constitute financial advice. Some content is AI-generated. See Disclaimer


