Stock Analysis · Halliburton Company (HAL)
Overview
Halliburton is one of the world’s largest oilfield services companies. It does not usually own the oil and gas reserves that get produced. Instead, it helps energy producers find, drill, complete, and manage wells. In simple terms, Halliburton sells the tools, engineering, software, equipment, chemicals, and field services that oil and gas companies need to bring hydrocarbons out of the ground and keep production running efficiently.
The business is organized into two main operating segments, and both are global. Completion and Production is the larger segment and focuses on the later stages of a well’s life, especially hydraulic fracturing, cementing, intervention, completion tools, and related production services. Drilling and Evaluation covers the earlier and more technical parts of the process, including drilling services, wireline, testing, fluids, and reservoir evaluation.
Based on the latest annual reporting structure, Halliburton’s revenue mix is approximately:
- Completion and Production: about 61% of revenue. This includes stimulation services such as pressure pumping, cementing, intervention, artificial lift, completion tools, and production chemicals.
- Drilling and Evaluation: about 39% of revenue. This includes drilling-related services, fluids, wireline and perforating, testing, and subsurface evaluation technologies.
Geographically, Halliburton is still heavily tied to North America, but it also has a large international presence across Latin America, Europe/Africa, Middle East/Asia, and other offshore and land markets. That matters because North America tends to move faster with oil and gas price swings, while international projects are often larger, longer-cycle, and somewhat steadier.
Looking at the broader earnings flow over recent years, the company has expanded sharply from the post-pandemic recovery period, then entered a more mixed phase with softer revenue and profit in 2025 after very strong conditions in 2022 through 2024. Even so, the business still produces meaningful operating income and cash flow, which is an important feature for a cyclical energy services company.
The long-term picture shows a business that recovered strongly after 2021, improved operating earnings materially through 2024, and then gave back part of that improvement in 2025 as market conditions cooled. The key takeaway is that Halliburton remains a large cash-generating operator, but its results are closely linked to activity levels in drilling and well completions.
Key Figures
| Metric | Value | Sector ⓘ |
|---|---|---|
| Date | Oct 24, 2026 | |
| Context | ||
| Sector | Energy | |
| Industry | Oil & Gas Equipment & Services | |
| Market Cap ⓘ | $27.98B | |
| Beta ⓘ | 0.84 | |
Value (Cheapness) | ||
| P/E Ratio ⓘ | 17.68 | 15.40 |
| P/B Ratio ⓘ | 2.54 | 1.71 |
| FCF Yield ⓘ | 5.72% | 8.24% |
| Dividend Yield ⓘ | N/A | 3.52% |
| EBIT / EV ⓘ | 8.50% | 7.45% |
| PEG ⓘ | 0.68 | |
Growth (Business expansion) | ||
| Revenue Growth ⓘ | 3.70% | 26.85% |
| RPS Growth (5Y CAGR) ⓘ | 11.40% | 6.78% |
| EPS Growth (5Y CAGR) ⓘ | -6.19% | -14.41% |
| BVPS Growth (5Y CAGR) ⓘ | 13.36% | 6.08% |
| Margin Growth (5Y Trend) ⓘ | 2.07% | 0.55% |
| FCF Growth (5Y CAGR) ⓘ | 10.73% | 2.75% |
| DPS Growth (5Y CAGR) ⓘ | 39.79% | 16.79% |
Quality (Business durability) | ||
| ROIC (Latest) ⓘ | 11.20% | 11.30% |
| ROA (Latest) ⓘ | 7.83% | 6.00% |
| ROIC (5Y Median) ⓘ | 14.31% | 10.35% |
| ROA (5Y Median) ⓘ | 6.90% | 5.46% |
| Net Debt / EBIT (Latest) ⓘ | 2.22 | 1.64 |
| Net Debt / EBIT (5Y Median) ⓘ | 1.99 | 1.82 |
| Net Debt / EBITDA (Latest) ⓘ | 1.57 | 1.08 |
| Net Debt / Assets ⓘ | 24.37% | 17.29% |
| EBITDA / Interest ⓘ | 13.87 | 9.53 |
| Operating Margin (Latest) ⓘ | 12.72% | 16.21% |
| Operating Margin (5Y Median) ⓘ | 14.80% | 20.55% |
| Debt to Equity (Latest) ⓘ | 73.74% | 52.27% |
| Profit Margin (Latest) ⓘ | 7.16% | 8.79% |
| Free Cash Flow (Latest) ⓘ | $1.60B | |
Momentum (Price trend) | ||
| 3Y Return ⓘ | -13.57% | +68.93% |
| 12M Return (excl. last month) ⓘ | +51.34% | +42.90% |
| 6M Return ⓘ | -10.11% | +9.18% |
| Price vs. 200-Day MA ⓘ | -4.18% | +9.87% |
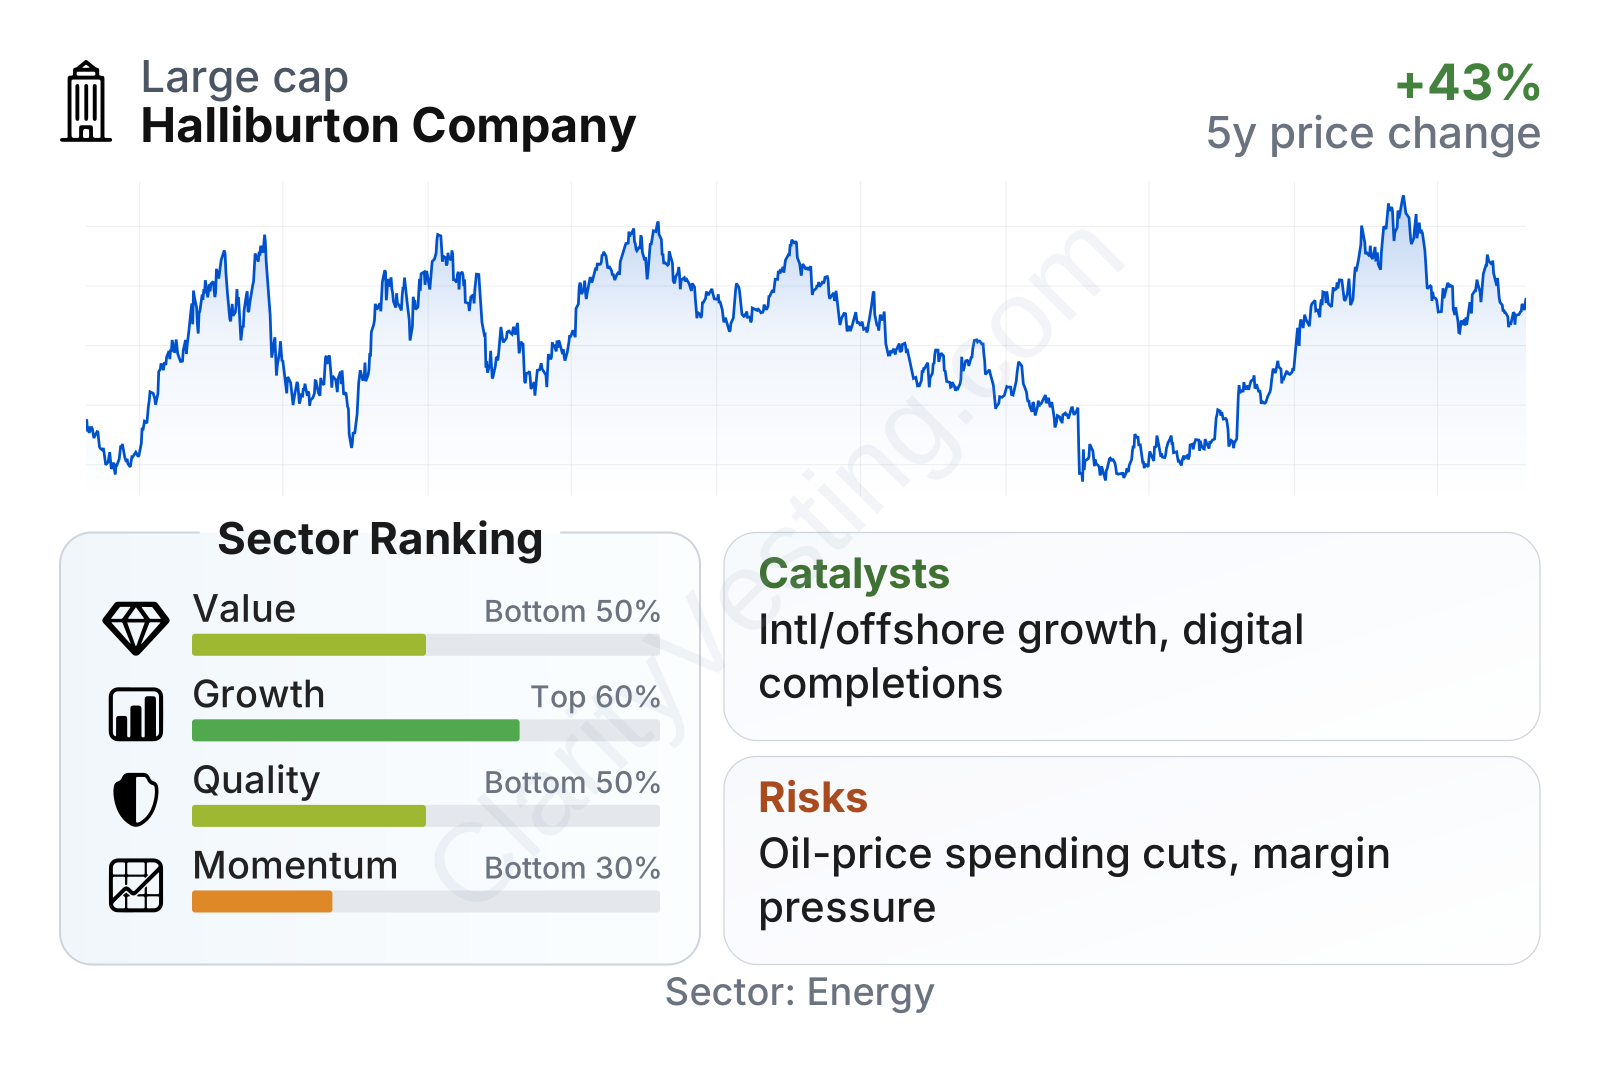
Halliburton is a large company in oilfield services, with a market value in the tens of billions of dollars and a share-price volatility that has recently been a bit lower than the broader market. On valuation, it sits near the middle of the energy sector by conventional measures, although its earnings multiple and book multiple are above sector medians. Growth and cash generation over a five-year view look better than many peers, especially in revenue per share, book value per share, free cash flow, and dividend growth. The weaker areas are quality and momentum: leverage is still above the sector median, margins are below many peers, and the stock’s longer multi-year price performance has lagged much of the energy group despite a stronger rebound over the last year.
Growth
Halliburton operates in a sector that should remain relevant for many years, but it is not a simple straight-line growth industry. Global energy demand is still growing, and oil and gas remain essential for transportation, industry, petrochemicals, and power systems in many regions. That creates continued demand for drilling and well services. At the same time, this is a cyclical market: customers spend more when commodity prices are supportive and pull back when they become cautious.
Halliburton’s strategy is sensible for that environment. The company has been emphasizing higher-margin technologies, digital tools, production optimization, and international markets where national oil companies and major producers often run long-duration projects. This is important because North America shale activity can slow quickly, while international work can provide a steadier base. Halliburton has also highlighted artificial intelligence, automation, and software-led workflows that can improve well productivity and lower customer costs, which helps defend its role even when budgets are under pressure.
Recent growth has clearly moderated. After very strong year-over-year increases in 2022 and early 2023, revenue growth slowed sharply, turned negative during parts of 2024 and 2025, and has only recently returned to low single-digit positive territory. That suggests Halliburton is no longer benefiting from the same post-recovery tailwind it had earlier in the cycle. For long-term analysis, that matters because the company now needs to rely more on market share, technology adoption, and international expansion rather than broad industry uplift alone.
Cash generation remains one of the more constructive parts of the picture. Free cash flow expanded strongly from 2022 through 2024 before cooling in the latest period. Even after that decline, Halliburton still appears capable of producing substantial cash, which supports debt reduction, dividends, and share repurchases. In a cyclical industry, that flexibility is valuable because it gives management more room to absorb slower periods without needing dramatic balance-sheet moves.
Recent company updates have continued to point toward a major opportunity in international and offshore work, as well as demand for more efficient completion technologies and digital solutions. Another useful tailwind is the need to offset natural decline rates from existing oil and gas fields. Even if commodity prices are not booming, producers still need to invest simply to maintain output. That structural need supports Halliburton’s relevance over time.
Risks
This article is for informational purposes only and does not constitute financial advice. Some content is AI-generated. See Disclaimer


