Stock Analysis · Guoco Group Limited (GULRF)
Overview
Guoco Group Limited is a Hong Kong-listed diversified holding company with activities spread across property development and investment, hospitality and leisure, gaming, financial services, and principal investment. In simple terms, it is a conglomerate: rather than depending on one business line, it owns and manages several different businesses in Asia, the United Kingdom, and other markets. Its best-known assets include GuocoLand in property, The Rank Group in gaming and entertainment, and GL Limited in hospitality.
That structure matters because Guoco is not driven by a single product cycle. Earnings can come from rental income, hotel operations, gaming venues, residential project sales, dividends from investee companies, and gains or losses from investment activities. The tradeoff is that the company can be harder to analyze than a pure-play real estate or leisure company, because performance depends on several industries at once.
Based on the latest annual reporting structure, Guoco’s revenue mix is led by property and hospitality-related activities, with gaming and leisure also contributing materially. A practical way to think about the group is the following:
- Property development and investment: the largest contributor. This includes residential project sales, commercial properties, and recurring rental income, mainly through GuocoLand and related assets.
- Hospitality and leisure: a major source of revenue through hotel ownership and operations, primarily under GL Limited.
- Gaming and entertainment: meaningful revenue from casinos, bingo, and digital gaming operations through The Rank Group.
- Financial and treasury-related activities, plus principal investment: a smaller but potentially volatile contributor, including interest income, dividend income, and investment gains or losses.
Because Guoco consolidates listed subsidiaries and investment holdings, exact percentages can shift meaningfully from year to year depending on property completion schedules, hotel demand, gaming conditions, and mark-to-market investment movements. At a high level, recent revenue has been most influenced by property and hospitality, with gaming adding another important stream and investment activities affecting profit more than top-line sales.
Operationally, recent years show rising total revenue and stronger gross profit, while financing costs have become much more manageable than they were earlier in the period shown. That combination suggests the group has improved the conversion of revenue into bottom-line profit even though its businesses remain cyclical.
The business mix shows a company with several income engines, but also one whose reported results can move sharply depending on project timing, hospitality demand, and the performance of listed subsidiaries.
Key Figures
| Metric | Value | Sector ⓘ |
|---|---|---|
| Date | Oct 03, 2026 | |
| Context | ||
| Sector | Industrials | |
| Industry | Conglomerates | |
| Market Cap ⓘ | $2.91B | |
| Beta ⓘ | 0.28 | |
Value (Cheapness) | ||
| P/E Ratio ⓘ | 5.71 | 22.45 |
| P/B Ratio ⓘ | 0.05 | 1.98 |
| FCF Yield ⓘ | 75.26% | 6.31% |
| Dividend Yield ⓘ | 5.50% | 1.96% |
| EBIT / EV ⓘ | N/A | 4.81% |
| PEG ⓘ | N/A | |
Growth (Business expansion) | ||
| Revenue Growth ⓘ | -12.40% | 9.10% |
| RPS Growth (5Y CAGR) ⓘ | 23.91% | 7.75% |
| EPS Growth (5Y CAGR) ⓘ | -26.72% | -13.59% |
| BVPS Growth (5Y CAGR) ⓘ | -4.31% | 6.22% |
| Margin Growth (5Y Trend) ⓘ | 16.00% | 0.72% |
| FCF Growth (5Y CAGR) ⓘ | 12.26% | 10.98% |
| DPS Growth (5Y CAGR) ⓘ | 13.01% | 9.48% |
Quality (Business durability) | ||
| ROIC (Latest) ⓘ | N/A | 10.92% |
| ROA (Latest) ⓘ | 5.46% | 5.41% |
| ROIC (5Y Median) ⓘ | 0.72% | 9.21% |
| ROA (5Y Median) ⓘ | 2.62% | 4.94% |
| Net Debt / EBIT (Latest) ⓘ | N/A | 2.07 |
| Net Debt / EBIT (5Y Median) ⓘ | 8.43 | 2.28 |
| Net Debt / EBITDA (Latest) ⓘ | N/A | 1.43 |
| Net Debt / Assets ⓘ | 26.13% | 19.27% |
| EBITDA / Interest ⓘ | N/A | 9.53 |
| Operating Margin (Latest) ⓘ | 22.01% | 10.50% |
| Operating Margin (5Y Median) ⓘ | 20.76% | 10.27% |
| Debt to Equity (Latest) ⓘ | 70.50% | 65.48% |
| Profit Margin (Latest) ⓘ | 14.59% | 6.62% |
| Free Cash Flow (Latest) ⓘ | $2.19B | |
Momentum (Price trend) | ||
| 3Y Return ⓘ | +27.95% | +58.56% |
| 12M Return (excl. last month) ⓘ | +1.08% | +15.63% |
| 6M Return ⓘ | 0.00% | +4.19% |
| Price vs. 200-Day MA ⓘ | +0.31% | +0.93% |
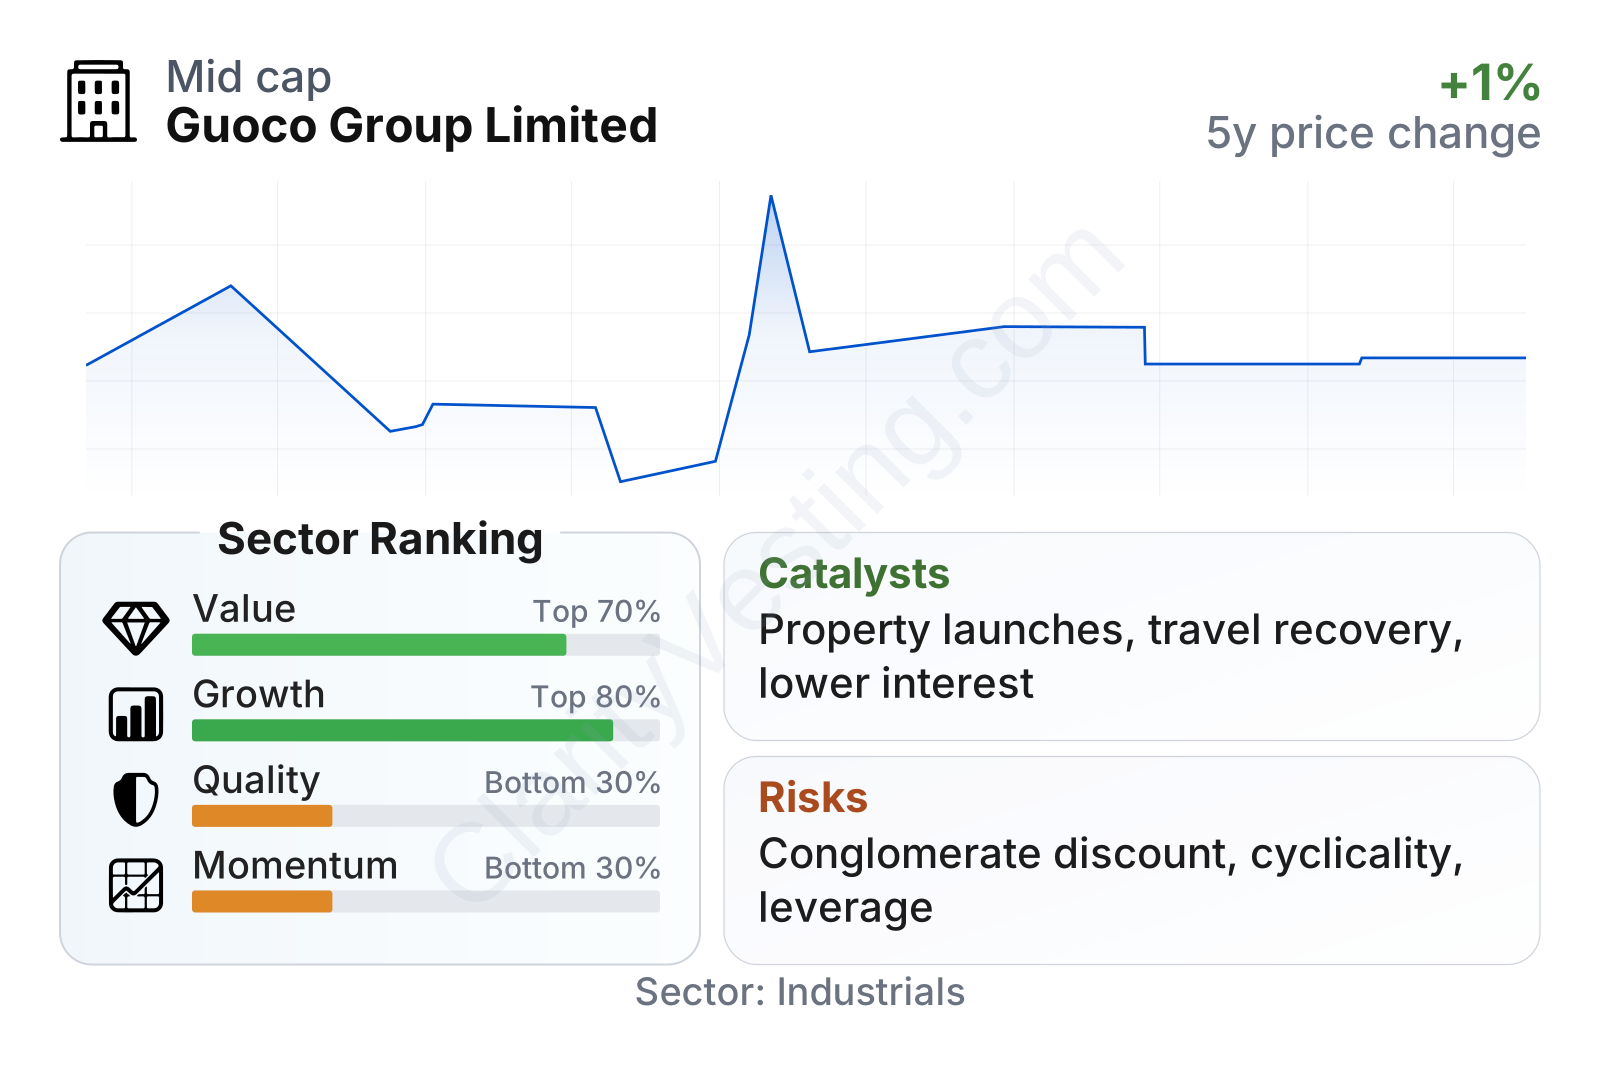
Guoco stands out on valuation and cash generation much more than on market momentum. The shares trade at a very low earnings multiple versus the broader industrials median, and the price-to-book ratio is exceptionally low. Free cash flow generation is also unusually strong, while the dividend yield is above the sector median. At the same time, recent revenue growth has been negative year over year, long-term earnings growth has been uneven, and share price performance has lagged the sector. Profitability is mixed: current operating and net margins are solid, but returns on invested capital over a longer period are weak, and leverage is somewhat above the sector norm. Overall, the picture is of a company that looks statistically cheap and cash generative, but not one that currently carries strong market confidence.
The stock chart also reflects that profile. Over the multi-year period shown, the share price has been unusually flat, with very limited movement compared with many listed industrial and property-linked companies. Combined with a beta around 0.3, that points to low trading volatility, but also to a market that has not been re-rating the business despite improved profitability.
Growth
Guoco operates in sectors that can still grow over time, but they are not straightforward high-growth areas. Property development in Singapore and selected Asian markets can benefit from urbanization, wealth creation, and commercial demand, yet it remains cyclical and sensitive to interest rates. Hospitality benefits from travel normalization and premium asset locations, while gaming and leisure can grow through digital channels and customer recovery trends. In other words, Guoco’s end markets are viable for future expansion, but they are tied to economic conditions rather than rapid structural growth alone.
The group’s strategy makes sense for a long-duration owner if viewed as capital allocation across hard assets and consumer-facing businesses. Property assets can create recurring rental streams and development profits. Hotels and gaming operations provide operating cash flow that can recover strongly when travel and discretionary spending are healthy. The conglomerate model also gives management flexibility to recycle capital between subsidiaries and investments.
A meaningful positive point is the recent revenue and margin trajectory visible over the last several years. Revenue has risen from about $1.9 billion in fiscal 2022 to just above $3.1 billion in fiscal 2025, while operating income and net income have also improved overall. Interest expense dropped sharply after the unusually high level recorded in fiscal 2023, which helped earnings quality. Even though the most recent year-over-year growth rate is negative in the metric snapshot, the longer multi-year picture is more constructive on sales per share, free cash flow, and dividends per share.
One potential catalyst is the continued normalization of travel and leisure activity, which can support hotel occupancy, room rates, and gaming volumes. Another is project completions and launches in the property segment, where earnings can be lumpy but substantial when developments are recognized. Guoco’s large discount to book value and low earnings multiple also create the possibility of future market reassessment if the group continues converting asset value into cash flow and reported profit.
There is also a balance-sheet-related growth angle. As financing costs have become less burdensome than in earlier periods, more operating profit can flow through to net earnings and cash generation. For a diversified group with capital-intensive businesses, that change can materially affect long-term compounding.
Risks
This article is for informational purposes only and does not constitute financial advice. Some content is AI-generated. See Disclaimer


