Stock Analysis · Greentown China Holdings Limited (GTWCF)
Overview
Greentown China Holdings Limited is a Chinese real estate developer focused mainly on residential property. The group develops and sells homes, but it also earns recurring income from property management, hotel operations, project management, design, and other real-estate-related services. The company is best known for its presence in China’s higher-end housing market and for working through both self-developed projects and projects managed for other parties.
Its revenue base is still dominated by property development and sales, while service activities add diversification. Based on recent annual reporting and the company’s business structure, the main revenue sources can be summarized as follows:
- Property sales and development: approximately 85% to 95% of revenue. This includes the sale of residential units and related properties developed by the group and its project platforms.
- Project management: approximately 3% to 8% of revenue. This activity includes development management services provided to third-party landowners or partners, a business model that typically uses less capital than direct development.
- Property investment, hotel operations, and other services: approximately 1% to 5% of revenue combined. This includes rental income, hospitality, design, consulting, and other ancillary services.
The business mix matters because property sales generate the vast majority of revenue but also carry the greatest sensitivity to housing demand, pricing, financing conditions, and construction cycles. The service and management businesses are smaller, yet they can help stabilize earnings when the development market is weak.
Over the last several years, revenue expanded meaningfully, but the flow from revenue to profit became much thinner. The broad pattern is clear: sales remained large, cost of revenue absorbed most of the top line, and net income shrank sharply by 2025 even though the company was still generating substantial cash flow.
Key Figures
| Metric | Value | Sector ⓘ |
|---|---|---|
| Date | Oct 17, 2026 | |
| Context | ||
| Sector | Real Estate | |
| Industry | Real Estate - Development | |
| Market Cap ⓘ | $3.68B | |
| Beta ⓘ | 0.82 | |
Value (Cheapness) | ||
| P/E Ratio ⓘ | N/A | 17.38 |
| P/B Ratio ⓘ | 0.01 | 0.85 |
| FCF Yield ⓘ | 783.91% | 7.38% |
| Dividend Yield ⓘ | N/A | 4.85% |
| EBIT / EV ⓘ | N/A | 3.78% |
| PEG ⓘ | 0.47 | |
Growth (Business expansion) | ||
| Revenue Growth ⓘ | -26.00% | 5.30% |
| RPS Growth (5Y CAGR) ⓘ | 84.46% | 6.02% |
| EPS Growth (5Y CAGR) ⓘ | -27.25% | -11.37% |
| BVPS Growth (5Y CAGR) ⓘ | 56.12% | 0.45% |
| Margin Growth (5Y Trend) ⓘ | -10.24% | -0.22% |
| FCF Growth (5Y CAGR) ⓘ | -37.70% | 5.40% |
| DPS Growth (5Y CAGR) ⓘ | 60.84% | 5.02% |
Quality (Business durability) | ||
| ROIC (Latest) ⓘ | N/A | 5.69% |
| ROE (Latest) ⓘ | -0.82% | 7.56% |
| ROA (Latest) ⓘ | -0.06% | 2.85% |
| ROIC (5Y Median) ⓘ | 4.86% | 4.22% |
| ROE (5Y Median) ⓘ | 6.23% | 6.03% |
| ROA (5Y Median) ⓘ | 0.52% | 2.44% |
| Net Debt / EBIT (Latest) ⓘ | 4.71 | 7.59 |
| Net Debt / EBIT (5Y Median) ⓘ | 6.09 | 8.40 |
| Net Debt / EBITDA (Latest) ⓘ | 4.32 | 5.27 |
| Net Debt / Assets ⓘ | 15.58% | 37.76% |
| EBITDA / Interest ⓘ | N/A | 4.10 |
| Operating Margin (Latest) ⓘ | 5.22% | 35.29% |
| Operating Margin (5Y Median) ⓘ | 9.62% | 37.31% |
| Debt to Equity (Latest) ⓘ | 373.90% | 88.87% |
| Profit Margin (Latest) ⓘ | -0.04% | 19.61% |
| Free Cash Flow (Latest) ⓘ | $28.87B | |
Momentum (Price trend) | ||
| 3Y Return ⓘ | +4.28% | +30.75% |
| 12M Return (excl. last month) ⓘ | +62.26% | +4.36% |
| 6M Return ⓘ | 0.00% | -2.52% |
| Price vs. 200-Day MA ⓘ | +3.88% | -2.34% |
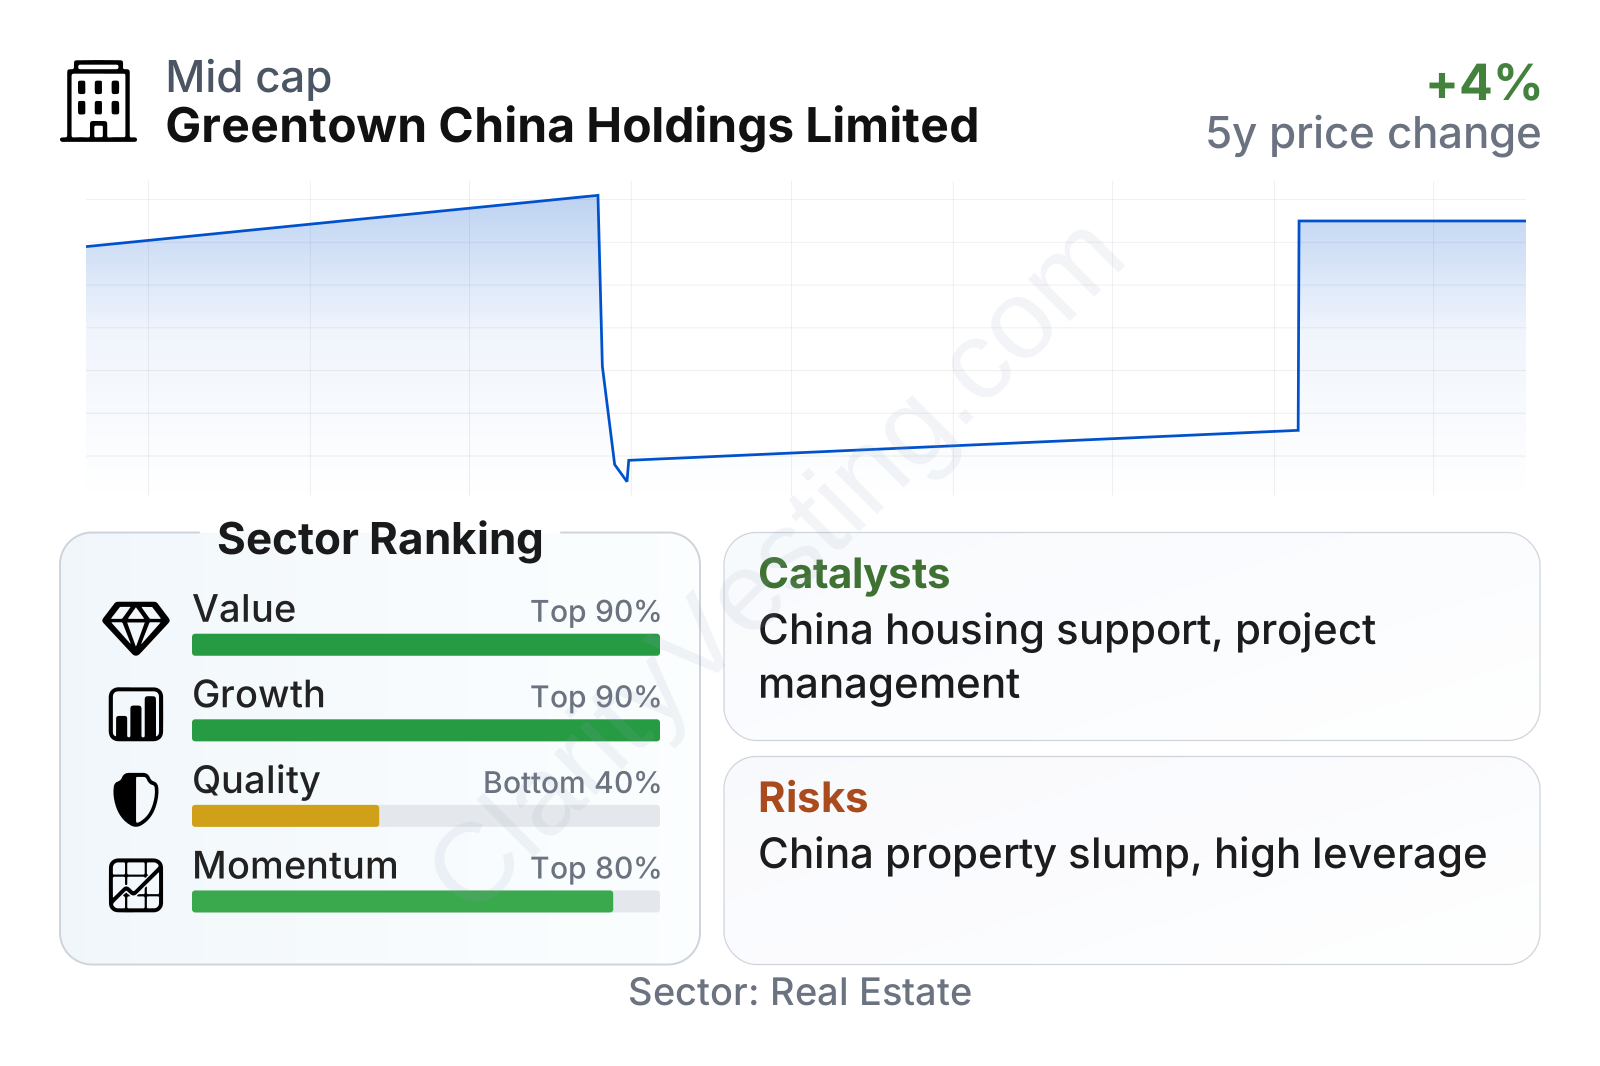
Greentown sits in the mid-sized range by market value, and its share-price behavior has been less volatile than the broader market, with a beta below 1. On valuation screens, the stock looks extremely cheap relative to the real estate sector, especially on price-to-book. At the same time, the quality picture is weaker: recent profitability is thin to negative, return on equity and return on assets are below sector norms, and leverage remains high with debt-to-equity well above the sector median. Growth measures are mixed, with very strong multi-year expansion in revenue per share and book value per share, but a recent year-over-year revenue decline and pressure on earnings and margins.
Growth
Greentown operates in a sector that remains economically important in China, but it is no longer a straightforward growth market. Chinese residential development has moved from a long boom into a more selective environment shaped by weak buyer confidence, tighter funding conditions, and policy efforts aimed at stabilizing the housing system rather than reigniting speculation. That means future growth is likely to come less from broad market expansion and more from market-share shifts, execution quality, and business mix.
In that context, Greentown’s strategy still has logic. The group has a recognizable brand in higher-quality residential projects and also has a project-management business that can expand with lower capital intensity than traditional land-heavy development. That matters because developers that can rely more on management fees and less on aggressive balance-sheet expansion are generally better placed in a cautious property cycle.
The long-term revenue-per-share trend has been strong, which indicates that the company has been able to scale its business over time despite the sector downturn. However, the latest annual decline in revenue and the drop in net profit show that size alone is not enough; margins, pricing discipline, and collections now matter more than headline sales volume.
The dividend pattern has also been uneven. Over a five-year period, distributions grew quickly from a low base, but the sustainability of payouts is harder to judge when profits are under pressure. For a developer in today’s Chinese market, cash preservation and debt management are at least as important as dividend continuity.
A practical catalyst for Greentown is any continued policy support for China’s housing sector, especially measures that improve homebuyer sentiment, financing access, or project delivery confidence. Another company-specific opportunity is further growth in project management, which can deepen relationships with local governments and landowners while requiring less balance-sheet risk than fully owned developments. The company’s relatively strong free cash flow also stands out in a sector where liquidity has been a central issue.
Recent operating trends suggest a mixed but not entirely weak backdrop: the share price has recovered better than much of the sector over the past year, and the stock trades above its long-term moving average. That does not resolve the underlying earnings pressure, but it does suggest that the market has noticed some stabilization.
Risks
This article is for informational purposes only and does not constitute financial advice. Some content is AI-generated. See Disclaimer


