Stock Analysis · Goldman Sachs BDC Inc (GSBD)
Overview
Goldman Sachs BDC Inc. is a business development company, or BDC. In simple terms, it lends money to midsize private U.S. companies that are often too large for small-business loans but not large enough to easily raise money in public markets. The company is externally managed by Goldman Sachs Asset Management, which gives it access to a large credit platform, underwriting resources, and a broad deal network.
Its portfolio is built mainly around corporate loans, especially senior secured debt. These are loans that stand near the top of the repayment order if a borrower runs into trouble. GSBD’s goal is to collect interest income from those loans, while also preserving capital and occasionally earning gains from equity co-investments or exits.
The company’s revenue comes primarily from investment income on its portfolio. Based on recent annual filings, the mix is dominated by recurring interest-related income, with smaller contributions from fees and occasional realized or unrealized gains.
- Interest income from debt investments: approximately 85% to 95% of total investment income in most periods. This mainly includes cash interest and payment-in-kind interest earned on first-lien, second-lien, and other private credit loans.
- Dividend income and other investment income: generally less than 10%. This can include fee income, prepayment fees, amendment fees, and dividends from equity or fund investments.
- Net realized and unrealized gains: variable and not a stable operating revenue source. These come from valuation changes or exits and can materially affect reported earnings from one period to another.
GSBD is not a traditional bank. It does not take deposits. Instead, it raises capital from shareholders and uses debt facilities and notes to finance a portfolio of private loans. That structure makes the quality of its underwriting, portfolio diversification, and funding costs especially important.
The business has shown meaningful swings in reported revenue and net income over the last several years, which is common for BDCs because portfolio valuations and credit conditions can move results sharply from year to year. Even so, the core model remains straightforward: lend to private companies, earn yield, manage credit losses, and distribute most taxable income to shareholders.
The income profile is heavily influenced by interest expense and credit-related valuation changes. That helps explain why net income can move much more sharply than top-line investment income, even when the underlying lending business remains active.
Key Figures
| Metric | Value | Sector ⓘ |
|---|---|---|
| Date | Oct 17, 2026 | |
| Context | ||
| Sector | Financial Services | |
| Industry | Asset Management | |
| Market Cap ⓘ | $1.02B | |
| Beta ⓘ | 0.66 | |
Value (Cheapness) | ||
| P/E Ratio ⓘ | 17.48 | 12.26 |
| P/B Ratio ⓘ | 0.76 | 1.23 |
| FCF Yield ⓘ | 8.69% | 10.40% |
| Dividend Yield ⓘ | 13.96% | 3.02% |
| EBIT / EV ⓘ | N/A | 8.14% |
| PEG ⓘ | 2.15 | |
Growth (Business expansion) | ||
| Revenue Growth ⓘ | -8.00% | 9.35% |
| RPS Growth (5Y CAGR) ⓘ | 5.83% | 12.19% |
| EPS Growth (5Y CAGR) ⓘ | -43.89% | -9.53% |
| BVPS Growth (5Y CAGR) ⓘ | -6.16% | 4.99% |
| Margin Growth (5Y Trend) ⓘ | 114.52% | -3.86% |
| FCF Growth (5Y CAGR) ⓘ | N/A | 4.81% |
| DPS Growth (5Y CAGR) ⓘ | 1.57% | 8.79% |
Quality (Business durability) | ||
| ROIC (Latest) ⓘ | N/A | 9.49% |
| ROE (Latest) ⓘ | 4.16% | 13.90% |
| ROA (Latest) ⓘ | 1.75% | 1.55% |
| ROIC (5Y Median) ⓘ | 4.70% | 7.86% |
| ROE (5Y Median) ⓘ | 7.96% | 12.17% |
| ROA (5Y Median) ⓘ | 3.41% | 1.30% |
| Net Debt / EBIT (Latest) ⓘ | N/A | 0.96 |
| Net Debt / EBIT (5Y Median) ⓘ | 9.42 | 0.73 |
| Net Debt / EBITDA (Latest) ⓘ | 9.38 | 0.92 |
| Operating Margin (Latest) ⓘ | N/A | 22.30% |
| Operating Margin (5Y Median) ⓘ | 171.35% | 24.63% |
| Debt to Equity (Latest) ⓘ | 136.46% | 58.56% |
| Profit Margin (Latest) ⓘ | 17.19% | 26.57% |
| Free Cash Flow (Latest) ⓘ | $88.96M | |
Momentum (Price trend) | ||
| 3Y Return ⓘ | +0.79% | +88.33% |
| 12M Return (excl. last month) ⓘ | +3.83% | +19.38% |
| 6M Return ⓘ | +12.36% | +4.75% |
| Price vs. 200-Day MA ⓘ | +5.80% | +3.50% |
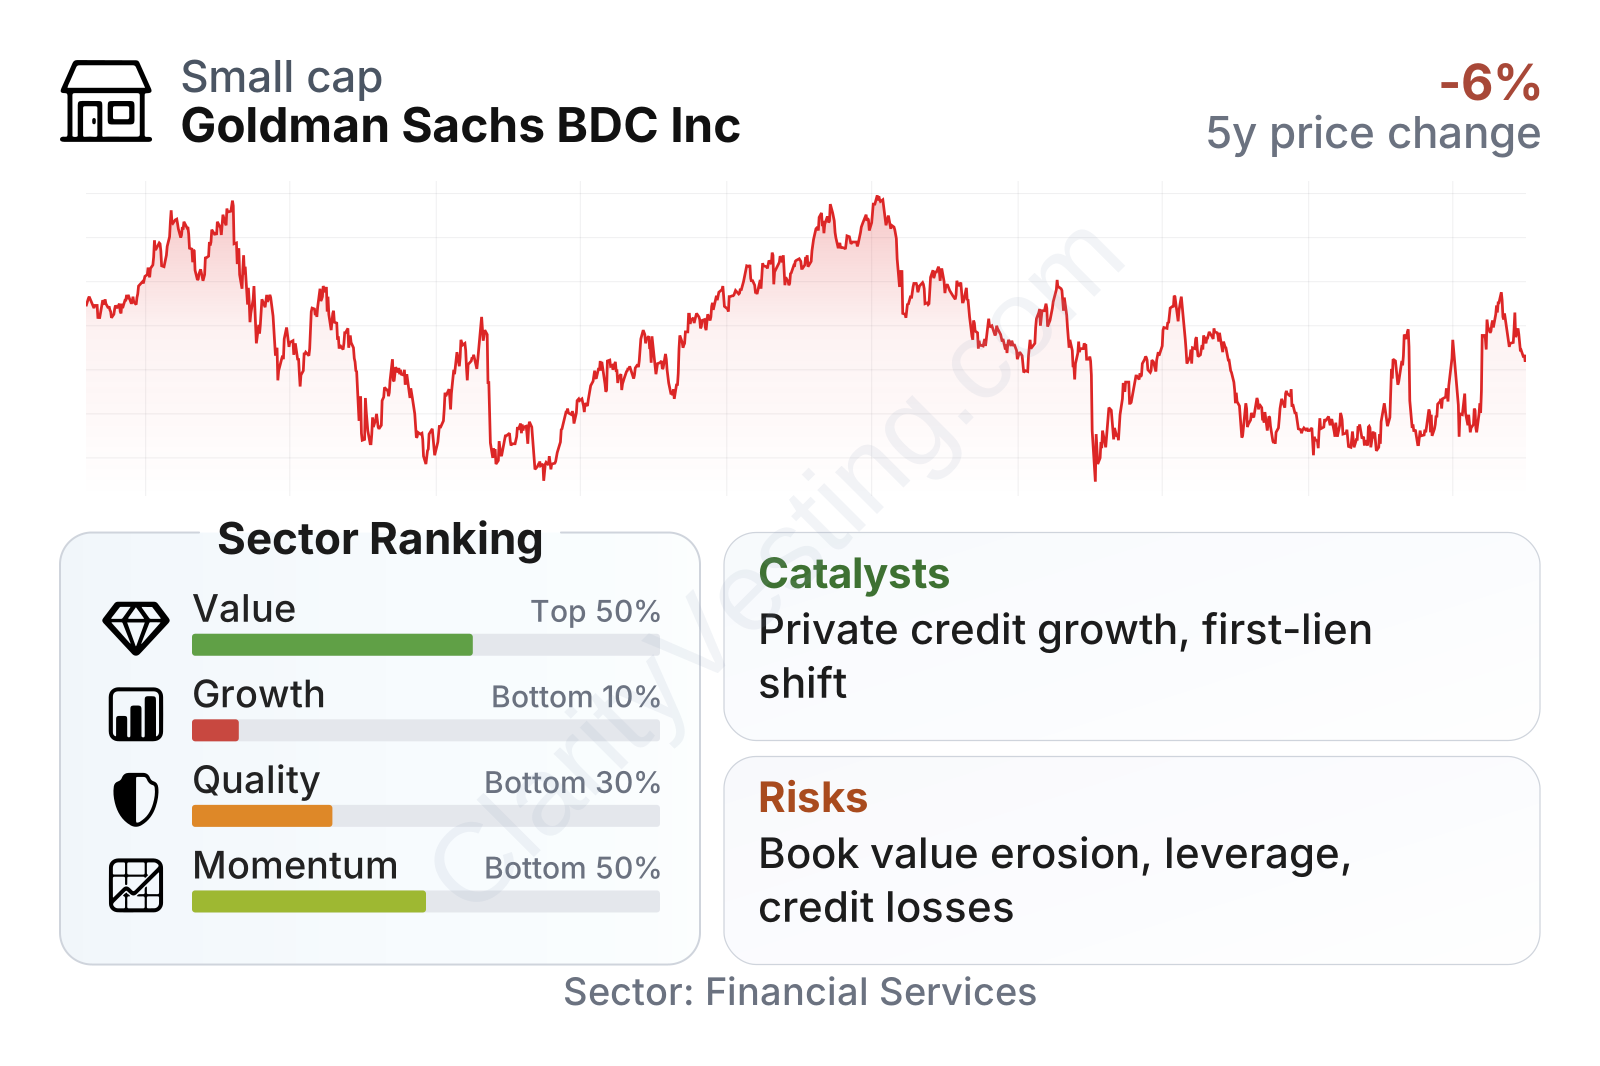
GSBD is a relatively small public financial company with a market value around $1 billion and a below-market beta, which points to lower share-price sensitivity than many stocks. The current profile is mixed: income-oriented metrics look strong, especially the dividend yield and price-to-book discount, but growth and profitability measures rank weakly versus much of the sector. That combination fits a company that trades more on asset value, portfolio quality, and income stability than on fast expansion.
The stock’s longer-term price path has been fairly flat to down over the last several years, with periodic recoveries but no sustained upward rerating. That usually signals that the market is waiting for stronger evidence on earnings durability, book value stability, and credit performance.
Growth
GSBD operates in private credit, a part of finance that has grown significantly as banks have pulled back from some middle-market lending after tighter capital rules and more cautious balance-sheet management. That broader industry backdrop is favorable. Many midsize companies still need flexible financing, and large asset managers have been taking share in this market. In that sense, GSBD is active in a sector with a real long-term demand base.
Its strategy also makes sense on paper. The company focuses mainly on senior secured lending and works through Goldman Sachs’ broader origination and credit platform. That can help with sourcing deals, negotiating loan protections, and accessing repeat borrowers backed by private equity sponsors. For a BDC, scale and sponsor relationships matter because they can improve selectivity and reduce the pressure to reach for riskier loans.
Still, GSBD’s own growth record has been modest to weak. Revenue growth has recently turned negative year over year, five-year revenue-per-share growth has trailed the sector median, and earnings per share have been uneven.
The earnings trend shows that profitability has not followed a smooth upward path. Annual EPS was relatively stable through 2024, then dropped in 2025, which suggests pressure from lower portfolio income, higher funding costs, credit marks, or some combination of those factors. For a lender like GSBD, long-term growth is less about rapid expansion and more about maintaining net investment income while avoiding book-value erosion.
Book value per share has moved lower over the past several years. That matters because book value is one of the clearest ways to judge whether a BDC is preserving shareholder capital over time. A declining book value does not automatically signal a broken model, but it does mean growth has not translated into stronger underlying net asset value.
A potential catalyst is the continued expansion of private credit as an asset class, especially if borrower demand remains healthy and capital market conditions favor direct lenders over public bond issuance. Another opportunity is refinancing activity: when loans are repaid and redeployed into attractive new investments, portfolio earnings can recover if spreads remain appealing. Company filings and investor materials also point to ongoing portfolio repositioning toward first-lien loans, which could improve resilience even if it limits upside.
Recent company updates have continued to emphasize portfolio quality, sponsor-backed lending, and disciplined originations. In the current environment, that is more important than aggressive loan growth. For GSBD, the main growth question is not whether private credit is expanding overall, but whether the company can convert that backdrop into steadier income per share and a firmer book value trend.
Risks
This article is for informational purposes only and does not constitute financial advice. Some content is AI-generated. See Disclaimer


