Stock Analysis · Green Plains Renewable Energy Inc (GPRE)
Overview
Green Plains Renewable Energy Inc. is a U.S. biofuels and agricultural processing company best known for producing ethanol. Over time, it has tried to move beyond being a simple commodity ethanol producer and reposition itself as a higher-value biorefining platform. In practical terms, the company buys corn, processes it in its plants, sells ethanol and related products, and is also building businesses around specialty ingredients, low-carbon feedstocks, and renewable-corn-oil-based offerings.
Its revenue still comes mainly from selling products tied to the ethanol production process. Based on the company’s recent annual reporting structure, the largest sources of revenue are approximately:
- Ethanol: about 70% to 80% of total revenue. This is the company’s core product, sold into fuel markets and blended with gasoline.
- Distillers grains and other feed products: about 10% to 20%. These are animal feed co-products created after corn is processed.
- Corn oil: about 5% to 10%. This can be sold into feed, industrial, and renewable fuel value chains.
- Commodity and ingredient merchandising, storage, and services: a smaller share that can vary by year, generally in the low-to-mid single digit percentage range when reported separately or embedded in broader segments.
The business model is therefore still highly exposed to ethanol economics, but management has been emphasizing a shift toward higher-margin ingredients and low-carbon products. That transition matters because traditional ethanol production is cyclical and often depends on corn prices, energy prices, blending demand, and policy support.
Over the last several years, the company’s sales base has contracted from earlier peaks, which reflects weaker industry conditions and portfolio changes. At the same time, Green Plains has continued investing in a more specialized operating model built around its biorefineries and downstream products.
The long-term pattern shows a business with very high production costs relative to revenue, which is typical in commodity processing, but also one where profits have been inconsistent. Revenue has come down materially since 2022, and net income remained negative through 2025, highlighting why the success of the company’s transformation strategy is so important.
Key Figures
| Metric | Value | Sector ⓘ |
|---|---|---|
| Date | Oct 17, 2026 | |
| Context | ||
| Sector | Basic Materials | |
| Industry | Chemicals | |
| Market Cap ⓘ | $1.09B | |
| Beta ⓘ | 1.15 | |
Value (Cheapness) | ||
| P/E Ratio ⓘ | 9.68 | 16.90 |
| P/B Ratio ⓘ | 1.45 | 1.65 |
| FCF Yield ⓘ | 10.82% | 5.76% |
| Dividend Yield ⓘ | N/A | 2.13% |
| EBIT / EV ⓘ | 10.04% | 6.30% |
| PEG ⓘ | 1.16 | |
Growth (Business expansion) | ||
| Revenue Growth ⓘ | -19.30% | 11.10% |
| RPS Growth (5Y CAGR) ⓘ | -15.44% | 4.49% |
| EPS Growth (5Y CAGR) ⓘ | N/A | -13.47% |
| BVPS Growth (5Y CAGR) ⓘ | -9.94% | 5.51% |
| Margin Growth (5Y Trend) ⓘ | N/A | -1.54% |
| FCF Growth (5Y CAGR) ⓘ | N/A | 0.37% |
| DPS Growth (5Y CAGR) ⓘ | -51.82% | 6.08% |
Quality (Business durability) | ||
| ROIC (Latest) ⓘ | 11.40% | 9.26% |
| ROA (Latest) ⓘ | 7.77% | 4.91% |
| ROIC (5Y Median) ⓘ | -2.33% | 7.70% |
| ROA (5Y Median) ⓘ | -4.60% | 3.86% |
| Net Debt / EBIT (Latest) ⓘ | 2.57 | 1.40 |
| Net Debt / EBIT (5Y Median) ⓘ | N/A | 1.70 |
| Net Debt / EBITDA (Latest) ⓘ | 1.53 | 0.95 |
| Net Debt / Assets ⓘ | 21.92% | 13.69% |
| EBITDA / Interest ⓘ | 3.22 | 12.34 |
| Operating Margin (Latest) ⓘ | 7.67% | 13.20% |
| Operating Margin (5Y Median) ⓘ | -1.55% | 11.80% |
| Debt to Equity (Latest) ⓘ | 63.07% | 40.56% |
| Profit Margin (Latest) ⓘ | 6.78% | 6.43% |
| Free Cash Flow (Latest) ⓘ | $118.17M | |
Momentum (Price trend) | ||
| 3Y Return ⓘ | -42.33% | +68.89% |
| 12M Return (excl. last month) ⓘ | +51.71% | +30.21% |
| 6M Return ⓘ | -3.05% | -4.16% |
| Price vs. 200-Day MA ⓘ | -0.71% | -1.27% |
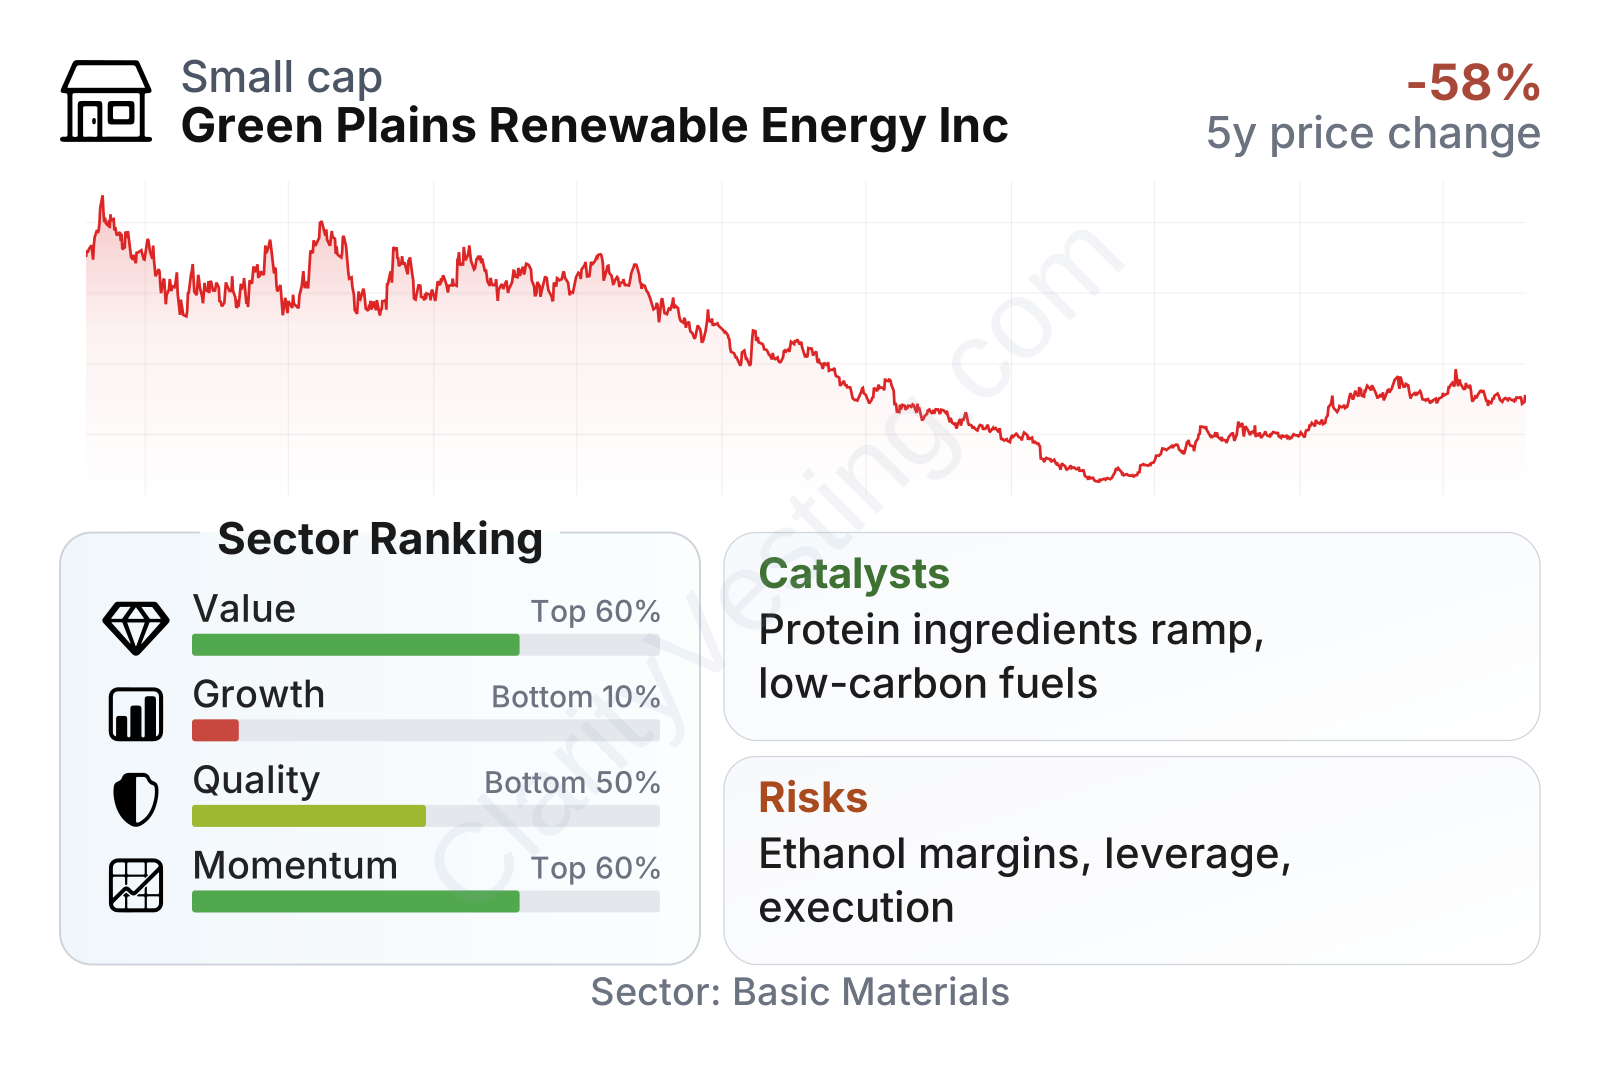
Green Plains is a mid-sized company by market value, with share-price behavior that has been more volatile than the broader market. The current factor picture is mixed. Valuation metrics look cheaper than many sector peers, helped by a low earnings multiple, a price-to-book ratio below the sector median, and a free-cash-flow yield that stands out positively. However, growth metrics are weak relative to the sector, reflecting shrinking revenue and a difficult five-year record. Quality is uneven as well: recent returns on capital have improved, but leverage remains elevated and interest coverage is much thinner than the sector norm.
Growth
Green Plains operates in a sector that has both mature and emerging parts. Ethanol itself is not a fast-growing industry in the traditional sense, especially in a market where gasoline demand is relatively steady and policy changes can shift economics. The more attractive growth angle comes from low-carbon fuels, renewable feedstocks, and higher-value corn-based ingredients. This is where Green Plains has been trying to build a more differentiated position.
The logic of the strategy is clear. Instead of relying only on ethanol margins, the company is working to extract more value from each bushel of corn through co-products and ingredients. If that effort scales successfully, Green Plains could become less dependent on pure fuel pricing and more exposed to markets where margins are structurally better.
That said, the recent growth record remains weak. Revenue growth turned negative in 2023 and stayed under pressure through 2026, showing that the company is still in the middle of a difficult reset rather than a smooth expansion phase. This is one of the biggest differences between the long-term strategic narrative and the current operating reality.
Cash generation has improved from deeply negative levels to positive territory more recently, which is one of the more encouraging operating signals. Positive free cash flow matters here because it suggests the company may be gaining more room to support plant upgrades, manage debt, and continue its transition without relying as heavily on outside capital.
Recent company updates have continued to highlight initiatives tied to ultra-high-protein feed ingredients, carbon reduction projects, and optimization of biorefinery assets. These projects are significant because they aim to raise the value of co-products while improving the carbon intensity profile of production. In an industry where policy incentives increasingly favor lower-carbon fuel pathways, that combination could become a meaningful catalyst if execution improves.
Risks
This article is for informational purposes only and does not constitute financial advice. Some content is AI-generated. See Disclaimer


