Stock Analysis · Gulfport Energy Operating Corp (GPOR)
Overview
Gulfport Energy Operating Corp is an independent oil and gas producer focused mainly on natural gas in the United States. Its core assets are in the Appalachia region, especially the Utica and Marcellus formations, and in the Anadarko Basin through its SCOOP position. In simple terms, the company drills wells, produces hydrocarbons, and sells those volumes into the market. Because of that business model, results are heavily influenced by commodity prices, production volumes, and how efficiently Gulfport can develop its acreage.
The business is much more gas-weighted than oil-weighted. Based on the company’s recent filings, revenue is primarily tied to the sale of natural gas, with smaller contributions from natural gas liquids and crude oil, plus some impact from hedging settlements that can either help or hurt reported sales depending on market prices and contract positions.
The main revenue sources can be summarized as follows:
- Natural gas: approximately 70% to 80% of product revenue in recent periods. This is the company’s largest source and comes from gas production sold from its Appalachian and Anadarko assets.
- Natural gas liquids: approximately 15% to 25% of product revenue. This category includes liquids separated from gas streams, such as ethane, propane, and butane.
- Oil and condensate: approximately 5% to 10% of product revenue. This is the smallest hydrocarbon stream but can still matter because liquids often have different pricing dynamics than dry gas.
- Derivative settlements and other items: this can swing between positive and negative contributions. It reflects the effect of hedging contracts and does not represent a core physical product stream.
Operationally, Gulfport is a mid-sized exploration and production company rather than an integrated energy giant. It does not have refining or retail operations to soften commodity cycles, so its economics depend mostly on the quality of its drilling inventory, cost control, and marketing arrangements for its production.
The long-term financial picture has been uneven, which is normal for many upstream energy companies. Revenue climbed sharply during the strong commodity environment of 2022, weakened in 2023 and 2024 as prices and other accounting items moved against the company, then improved again in 2025. That pattern reinforces a key point: Gulfport’s business can generate very strong cash flow, but results do not move in a straight line.
The profit flow over the last several years shows how sensitive Gulfport is to pricing and non-cash accounting effects. Revenue and operating income have swung widely, but the broader trend also shows that when market conditions improve, a large share of each revenue dollar can turn into operating profit and free cash flow.
Key Figures
| Metric | Value | Sector ⓘ |
|---|---|---|
| Date | Oct 17, 2026 | |
| Context | ||
| Sector | Energy | |
| Industry | Oil & Gas E&P | |
| Market Cap ⓘ | $3.02B | |
| Beta ⓘ | 0.56 | |
Value (Cheapness) | ||
| P/E Ratio ⓘ | 6.68 | 15.44 |
| P/B Ratio ⓘ | 1.63 | 1.73 |
| FCF Yield ⓘ | 8.27% | 8.20% |
| Dividend Yield ⓘ | N/A | 3.59% |
| EBIT / EV ⓘ | 16.65% | 7.46% |
| PEG ⓘ | N/A | |
Growth (Business expansion) | ||
| Revenue Growth ⓘ | -16.20% | 26.90% |
| RPS Growth (5Y CAGR) ⓘ | -0.41% | 6.90% |
| EPS Growth (5Y CAGR) ⓘ | -12.31% | -15.73% |
| BVPS Growth (5Y CAGR) ⓘ | 35.54% | 6.07% |
| Margin Growth (5Y Trend) ⓘ | 33.10% | 0.58% |
| FCF Growth (5Y CAGR) ⓘ | 15.35% | 1.86% |
| DPS Growth (5Y CAGR) ⓘ | 5.49% | 16.79% |
Quality (Business durability) | ||
| ROIC (Latest) ⓘ | 18.71% | 11.40% |
| ROA (Latest) ⓘ | 16.27% | 6.06% |
| ROIC (5Y Median) ⓘ | 30.59% | 10.30% |
| ROA (5Y Median) ⓘ | 14.51% | 5.42% |
| Net Debt / EBIT (Latest) ⓘ | 1.48 | 1.64 |
| Net Debt / EBIT (5Y Median) ⓘ | 1.31 | 1.83 |
| Net Debt / EBITDA (Latest) ⓘ | 0.98 | 1.08 |
| Net Debt / Assets ⓘ | 29.06% | 17.29% |
| EBITDA / Interest ⓘ | 16.83 | 9.64 |
| Operating Margin (Latest) ⓘ | 41.66% | 16.27% |
| Operating Margin (5Y Median) ⓘ | 23.66% | 20.39% |
| Debt to Equity (Latest) ⓘ | 50.48% | 54.76% |
| Profit Margin (Latest) ⓘ | 36.47% | 8.82% |
| Free Cash Flow (Latest) ⓘ | $250.00M | |
Momentum (Price trend) | ||
| 3Y Return ⓘ | +35.34% | +67.38% |
| 12M Return (excl. last month) ⓘ | -0.54% | +49.19% |
| 6M Return ⓘ | -13.30% | +7.07% |
| Price vs. 200-Day MA ⓘ | -8.28% | +9.56% |
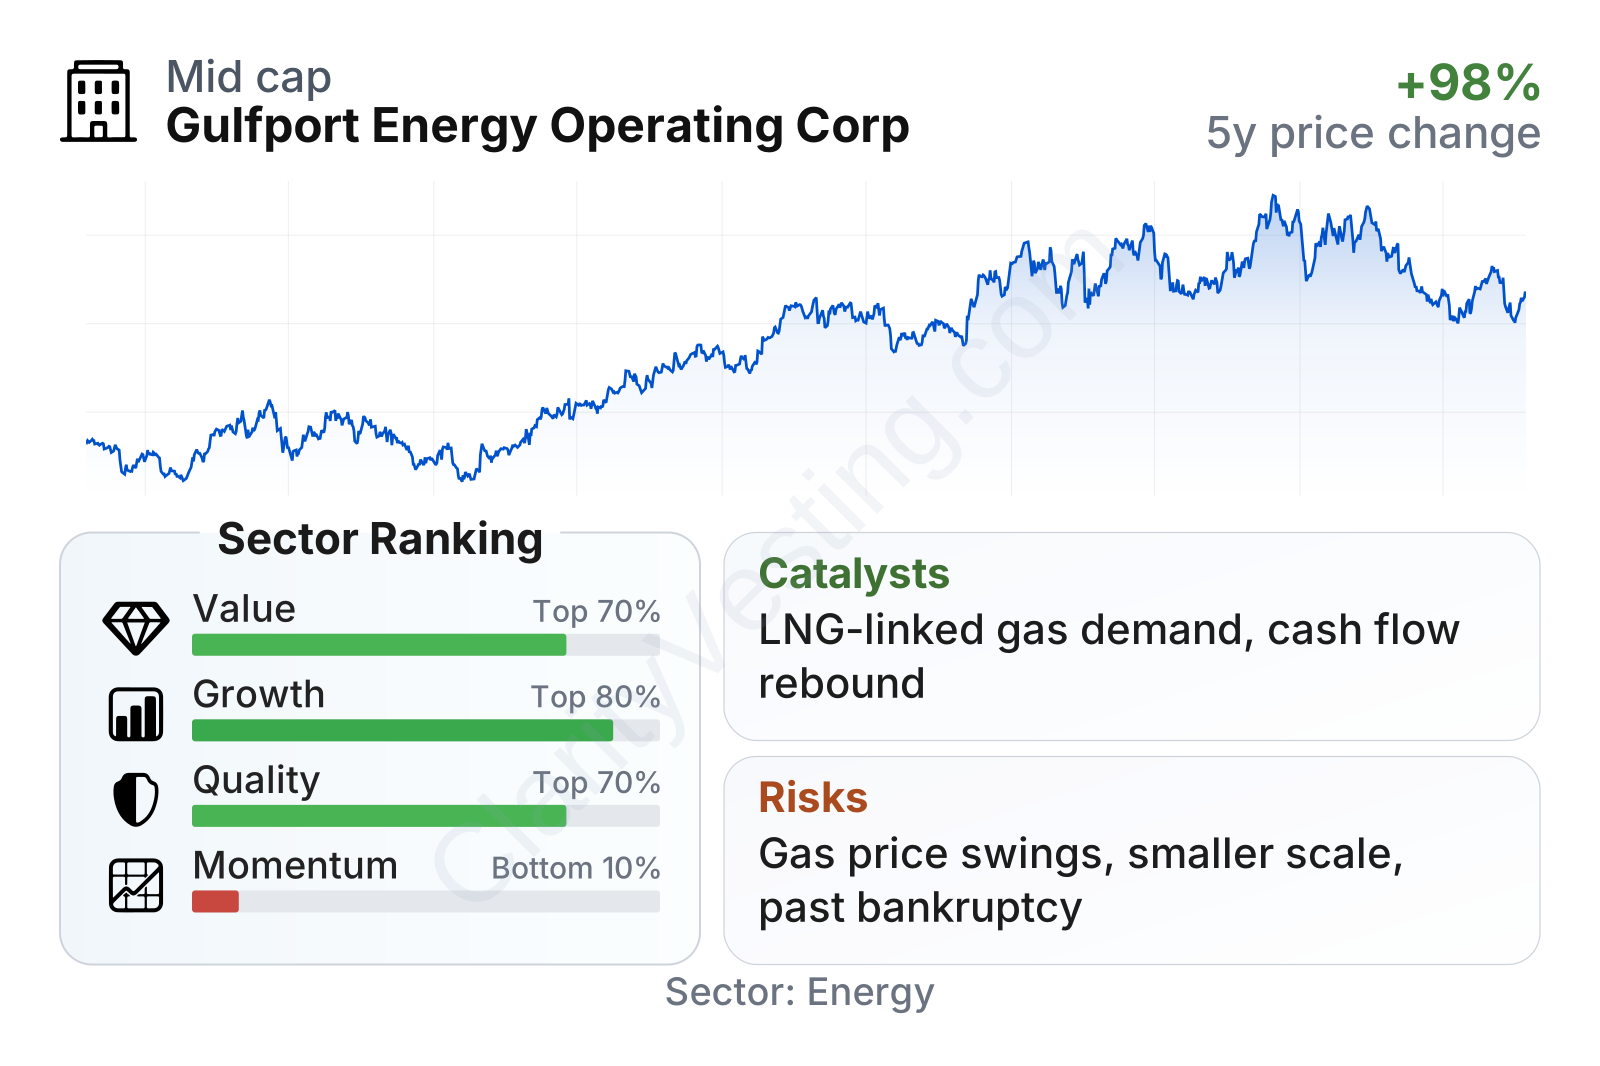
Gulfport currently stands out more for profitability and cash generation than for stock market momentum. Valuation measures look inexpensive relative to much of the sector, while returns on capital, operating margin, and profit margin are well above typical energy peers. Growth metrics are mixed because recent revenue has been volatile, but longer-term free cash flow growth and book value growth have been strong. The weakest area is recent price performance, which has lagged the sector by a wide margin despite the company’s solid operating profile.
The stock’s historical path also highlights the nature of the business. It has shown large swings over the last few years, rising strongly into parts of 2024 and early 2026 before retreating sharply. That kind of movement is common for producers tied closely to natural gas prices, even when underlying operations remain healthy.
Growth
Gulfport operates in a sector that still matters deeply to the U.S. economy. Natural gas remains a critical fuel for power generation, industrial use, exports, and balancing intermittent renewable energy. Longer term, one of the most important themes for gas producers is rising LNG export capacity from the United States. As more export projects come online, domestic gas demand has the potential to become broader and less tied only to local weather and industrial cycles.
For Gulfport specifically, the growth case is less about becoming a much larger producer every year and more about disciplined development of a concentrated portfolio. Management has emphasized capital efficiency, returns, debt management, and shareholder returns over simple volume expansion. For a cyclical producer, that strategy is generally more durable than chasing production growth at any cost. The company’s Appalachian position is especially important because those assets are among the core gas regions in North America.
Revenue growth has been highly cyclical rather than steady. The company moved from very strong growth in 2021 and parts of 2022 into a deep contraction during 2023, then returned to expansion through much of 2025 and early 2026 before softening again in the latest period. That pattern suggests Gulfport’s growth is driven primarily by commodity price conditions, hedging effects, and production mix rather than a simple linear increase in output.
Free cash flow gives a clearer view of the business than revenue alone. Even with volatility, Gulfport has remained capable of producing meaningful cash after capital spending, and the recent trend has improved from the weaker level seen in 2024. That matters because upstream companies ultimately create flexibility through cash generation: it can support debt reduction, share repurchases, acquisitions, or continued drilling without relying too heavily on outside financing.
A notable catalyst is the company’s continued focus on returning capital while keeping leverage under control. Another supportive factor is its exposure to natural gas pricing upside if U.S. demand strengthens through LNG exports, power demand, or colder-than-normal weather. In addition, Gulfport has periodically highlighted operational execution, including well productivity and inventory quality, as a way to support value even if commodity prices are not unusually strong.
Recent company communications have also pointed to portfolio optimization and disciplined capital allocation as central priorities. That does not guarantee fast headline growth, but it can improve the quality of growth by favoring higher-return wells and preserving balance sheet strength.
Risks
This article is for informational purposes only and does not constitute financial advice. Some content is AI-generated. See Disclaimer


