Stock Analysis · GPGI Inc (GPGI)
Overview
GPGI Inc operates in the industrials sector, within metal fabrication. Public information and the company’s financial profile indicate a business tied to manufacturing and engineered metal-based products and services. In simple terms, this is the kind of company that makes or processes physical industrial products rather than software or consumer brands, so demand is usually linked to construction, infrastructure, equipment, and broader industrial activity.
The recent financial pattern suggests that the company has been through a major business change. Revenue rose from about $268 million in 2021 to roughly $421 million in 2024, then dropped sharply in 2025. That kind of break in the trend often points to divestitures, restructurings, discontinued operations, or a significant reshaping of the business mix rather than an ordinary slowdown. For long-term analysis, this matters because past results may not fully describe the earnings power of the company as it stands today.
Detailed revenue by operating segment is not available in the material used here, so a reliable percentage breakdown by business line cannot be presented. What is visible is that the company’s revenue has historically come from selling fabricated industrial products and related services, with costs of revenue taking a meaningful share of sales and selling, general, and administrative expense also representing an important burden on profitability.
The most notable trend in the business flow is that gross profit remained positive through the reported period, but operating income turned negative in 2024 and net losses deepened in 2025. That means the core issue has not been an inability to generate gross profit from sales, but rather the weight of overhead, restructuring effects, and other below-gross-profit items.
The visual breakdown shows a business that once converted revenue into healthy gross profit, but then lost that advantage at the operating and net income levels. For a long-term reader, that points to a company in transition rather than a stable, mature industrial compounder.
Key Figures
| Metric | Value | Sector ⓘ |
|---|---|---|
| Date | Oct 24, 2026 | |
| Context | ||
| Sector | Industrials | |
| Industry | Metal Fabrication | |
| Market Cap ⓘ | $3.70B | |
| Beta ⓘ | 0.91 | |
Value (Cheapness) | ||
| P/E Ratio ⓘ | N/A | 22.29 |
| P/B Ratio ⓘ | 1.19 | 1.98 |
| FCF Yield ⓘ | 1.14% | 6.26% |
| Dividend Yield ⓘ | 0.04% | 1.92% |
| EBIT / EV ⓘ | -3.26% | 4.83% |
| PEG ⓘ | N/A | |
Growth (Business expansion) | ||
| Revenue Growth ⓘ | -100.00% | 9.30% |
| RPS Growth (5Y CAGR) ⓘ | -33.89% | 7.76% |
| EPS Growth (5Y CAGR) ⓘ | -30.21% | -13.17% |
| BVPS Growth (5Y CAGR) ⓘ | N/A | 6.13% |
| Margin Growth (5Y Trend) ⓘ | -194.42% | 0.74% |
| FCF Growth (5Y CAGR) ⓘ | N/A | 10.79% |
| DPS Growth (5Y CAGR) ⓘ | N/A | 9.41% |
Quality (Business durability) | ||
| ROIC (Latest) ⓘ | -5.48% | 10.75% |
| ROA (Latest) ⓘ | -15.93% | 5.41% |
| ROIC (5Y Median) ⓘ | N/A | 9.37% |
| ROA (5Y Median) ⓘ | 2.97% | 4.95% |
| Net Debt / EBIT (Latest) ⓘ | N/A | 2.04 |
| Net Debt / EBIT (5Y Median) ⓘ | 2.28 | 2.27 |
| Net Debt / EBITDA (Latest) ⓘ | N/A | 1.39 |
| Net Debt / Assets ⓘ | -0.22% | 19.27% |
| EBITDA / Interest ⓘ | N/A | 9.58 |
| Operating Margin (Latest) ⓘ | N/A | 10.49% |
| Operating Margin (5Y Median) ⓘ | 35.26% | 10.30% |
| Debt to Equity (Latest) ⓘ | N/A | 64.82% |
| Profit Margin (Latest) ⓘ | N/A | 6.67% |
| Free Cash Flow (Latest) ⓘ | $42.06M | |
Momentum (Price trend) | ||
| 3Y Return ⓘ | +165.52% | +67.77% |
| 12M Return (excl. last month) ⓘ | -37.29% | +12.05% |
| 6M Return ⓘ | -20.55% | 0.00% |
| Price vs. 200-Day MA ⓘ | -20.19% | +0.67% |
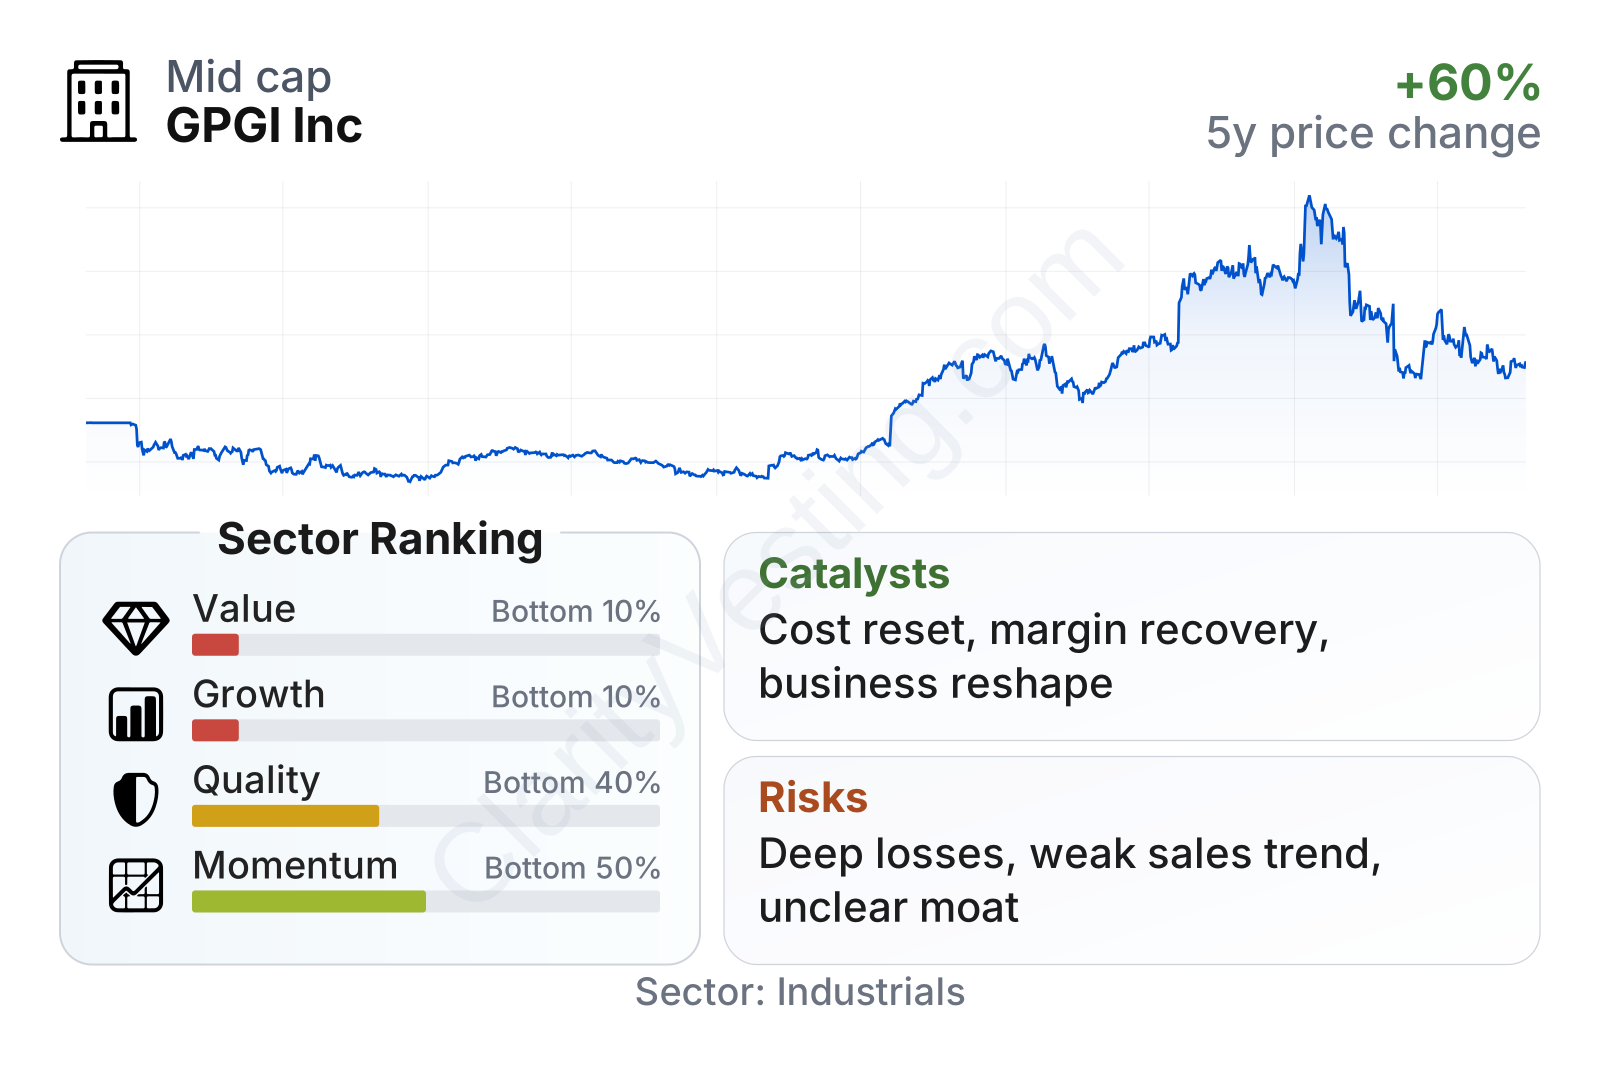
GPGI is a mid-sized industrial company by market value, with a share price history that has been highly volatile. The stock rose strongly over a multi-year period, but recent performance has weakened, with the shares trading well below their earlier 2026 levels and also below the long-term moving average. That combination usually signals that market confidence has cooled after a period of optimism.
The factor summary is weak overall. Growth ranks in the bottom 10% of the sector, and value also ranks in the bottom 10%, which is unusual because struggling companies often at least appear statistically cheap. Quality is somewhat better but still below average, while momentum is also weak after the recent pullback.
One positive point is balance-sheet flexibility. Net debt relative to assets is near zero or better, which suggests the company is not heavily burdened by leverage. Another positive is that free cash flow remains positive on the latest trailing measure in the table, even though profitability has deteriorated sharply. Still, returns on capital and assets are negative on a trailing basis, showing that the current business setup is not producing attractive earnings efficiency.
Growth
Metal fabrication is not usually a fast-growth industry on its own, but it can benefit from long industrial cycles such as infrastructure investment, domestic manufacturing activity, power-related projects, and equipment replacement. That gives companies in the space a path to growth, but usually not the kind of effortless expansion seen in software or platform businesses. Results depend heavily on execution, pricing discipline, plant utilization, and end-market demand.
GPGI’s own recent growth record is mixed and currently weak. Revenue growth was strong in 2022, slowed in 2023, stayed modest in 2024, and then turned sharply negative in the latest available period. That is far below the sector’s median pace and helps explain why the company ranks near the bottom of its peer group on growth measures.
The revenue trend points to a business that expanded meaningfully for a time, then hit a sharp reversal. If that reversal was caused mainly by portfolio changes or the sale of operations, future comparisons may become cleaner after the reset. If it reflects weakening demand in the remaining business, the challenge is more fundamental.
Cash generation also needs close attention. Free cash flow had been positive and even improving for several years, but the latest trailing period shows a sharp drop into negative territory on the chart. That kind of swing can happen during restructuring or heavy working-capital pressure, but it still reduces near-term financial flexibility.
From a strategic perspective, the company’s future growth case likely depends less on industry tailwinds alone and more on whether management can stabilize the business after its recent disruption. The strongest potential catalyst is therefore operational: a cleaner cost structure, better margins in the remaining business, and a return to consistent cash generation. Because the company is not very large relative to the broader industrial universe, successful repositioning could have an outsized impact on future results.
Risks
This article is for informational purposes only and does not constitute financial advice. Some content is AI-generated. See Disclaimer


