Stock Analysis · Gold.com Inc (GOLD)
Overview
Gold.com Inc operates an online platform centered on precious metals, especially physical gold and silver products, combined with related financial and custodial services. In simple terms, it is a digital marketplace where customers can buy bullion products, arrange storage, and in some cases access financing or other services tied to precious metals ownership. That makes the business different from a traditional miner: it is closer to a commerce and financial-services platform built around gold demand.
The company’s revenue is driven mainly by the value of metals sold through its platform. Because precious metals have high underlying product value but relatively thin transaction margins, reported revenue can be very large compared with profit. That pattern is visible in the company’s financials, where revenue has expanded sharply while net margin has remained narrow.
Public disclosures indicate the business is primarily built around transaction activity and precious-metals products rather than diversified fee streams. Exact segment percentages are not clearly broken out in the material reviewed, but the revenue mix appears to be concentrated in the following areas:
- Precious metals sales: likely the clear majority of revenue, generated from customer purchases of gold, silver, and related bullion products.
- Spread and transaction economics: the difference between purchase and sale prices, plus transaction-related charges embedded in platform activity.
- Storage, custody, and related services: recurring fees tied to safekeeping and account services, likely a much smaller share of revenue than metals sales.
- Other financial-service activity: may include lending or similar offerings connected to precious-metals accounts, but this does not appear to be the main revenue engine.
The most important point for long-term readers is that this is a scale business with very high revenue throughput but low operating margin. Revenue growth alone therefore does not tell the full story; what matters is whether the company can convert rising customer activity into steadier earnings and cash generation.
The flow of revenue and expenses shows exactly that challenge. Sales have surged over the last several years, especially into 2026, but the cost of revenue remains extremely high relative to sales, leaving only a modest gross profit pool. Operating income and net income have recovered from the weak 2025 period, yet profitability still looks much smaller than the headline revenue growth might suggest.
Key Figures
| Metric | Value | Sector ⓘ |
|---|---|---|
| Date | Oct 17, 2026 | |
| Context | ||
| Sector | Financial Services | |
| Industry | Capital Markets | |
| Market Cap ⓘ | $1.13B | |
| Beta ⓘ | 0.75 | |
Value (Cheapness) | ||
| P/E Ratio ⓘ | 13.31 | 12.26 |
| P/B Ratio ⓘ | 1.33 | 1.23 |
| FCF Yield ⓘ | 114.83% | 10.40% |
| Dividend Yield ⓘ | 1.99% | 3.02% |
| EBIT / EV ⓘ | 21.79% | 8.14% |
| PEG ⓘ | N/A | |
Growth (Business expansion) | ||
| Revenue Growth ⓘ | 99.20% | 9.35% |
| RPS Growth (5Y CAGR) ⓘ | 29.25% | 12.19% |
| EPS Growth (5Y CAGR) ⓘ | -9.38% | -9.53% |
| BVPS Growth (5Y CAGR) ⓘ | 10.39% | 4.99% |
| Margin Growth (5Y Trend) ⓘ | -1.64% | -3.86% |
| FCF Growth (5Y CAGR) ⓘ | N/A | 4.81% |
| DPS Growth (5Y CAGR) ⓘ | -2.96% | 8.79% |
Quality (Business durability) | ||
| ROIC (Latest) ⓘ | 10.61% | 9.49% |
| ROE (Latest) ⓘ | 11.73% | 13.90% |
| ROA (Latest) ⓘ | 2.45% | 1.55% |
| ROIC (5Y Median) ⓘ | N/A | 7.86% |
| ROE (5Y Median) ⓘ | 11.91% | 12.17% |
| ROA (5Y Median) ⓘ | 4.06% | 1.30% |
| Net Debt / EBIT (Latest) ⓘ | -3.36 | 0.96 |
| Net Debt / EBIT (5Y Median) ⓘ | 2.97 | 0.73 |
| Net Debt / EBITDA (Latest) ⓘ | -2.79 | 0.92 |
| Operating Margin (Latest) ⓘ | 0.67% | 22.30% |
| Operating Margin (5Y Median) ⓘ | 1.26% | 24.63% |
| Debt to Equity (Latest) ⓘ | 0.48% | 58.56% |
| Profit Margin (Latest) ⓘ | 0.32% | 26.57% |
| Free Cash Flow (Latest) ⓘ | $1.29B | |
Momentum (Price trend) | ||
| 3Y Return ⓘ | +46.01% | +88.33% |
| 12M Return (excl. last month) ⓘ | +79.28% | +19.38% |
| 6M Return ⓘ | -9.19% | +4.75% |
| Price vs. 200-Day MA ⓘ | -8.99% | +3.50% |
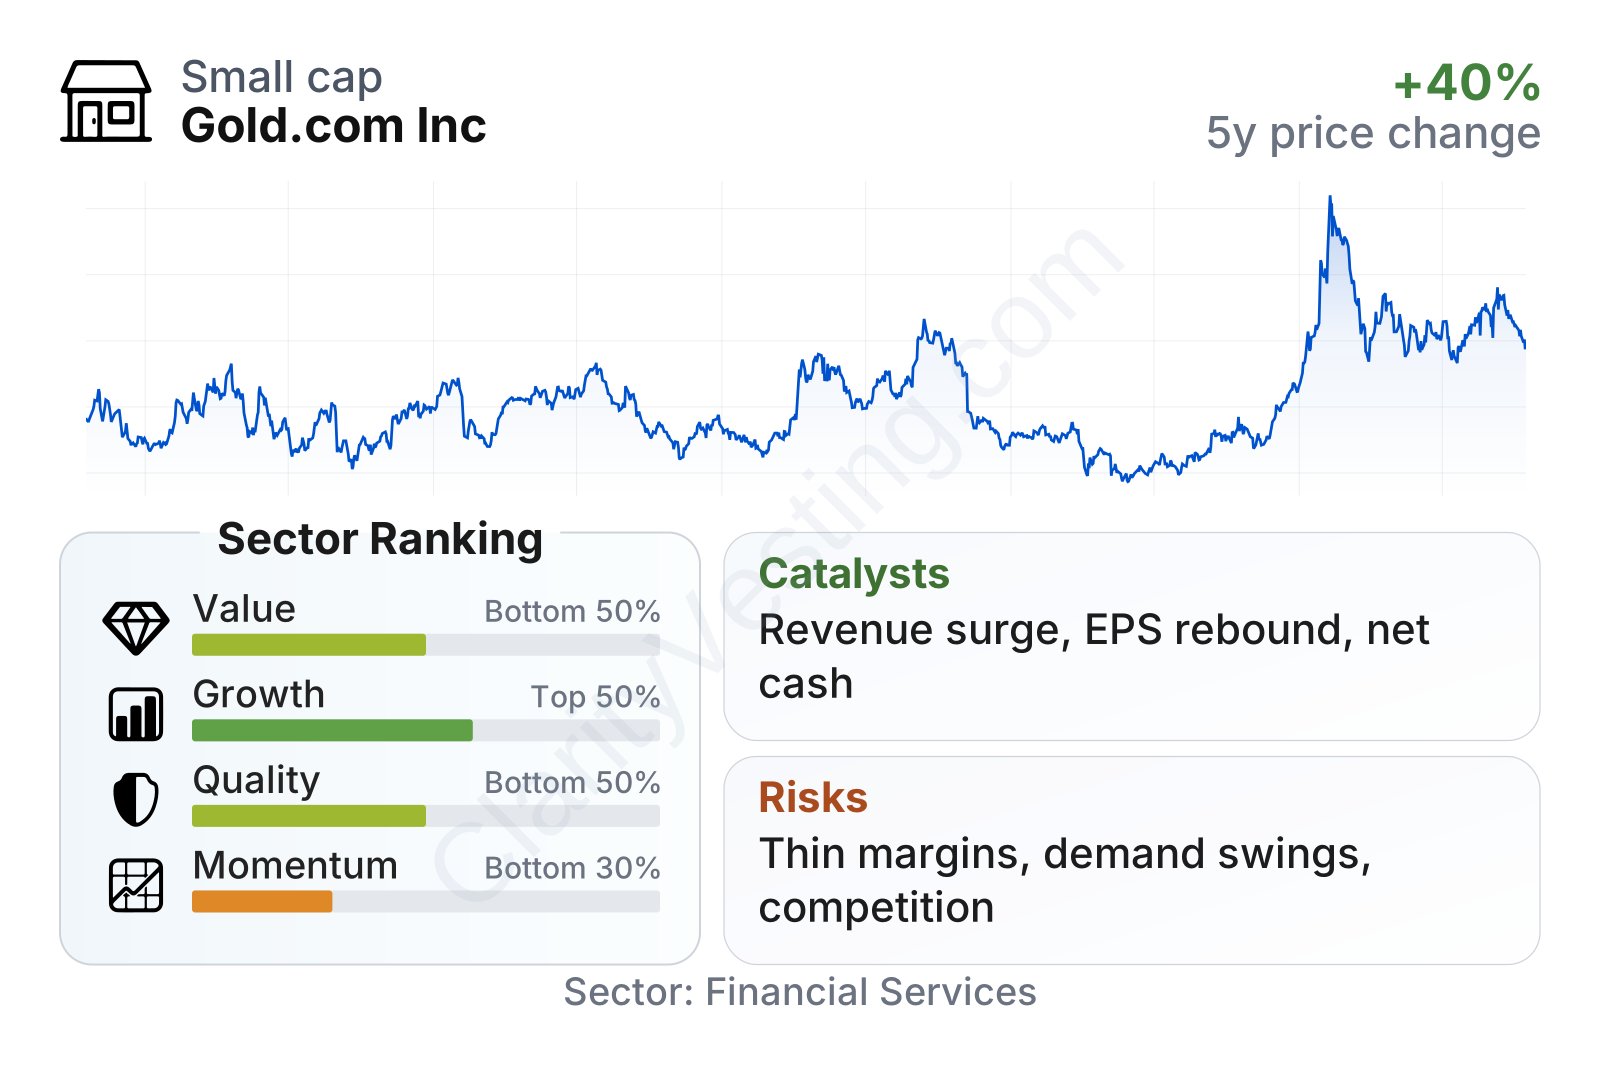
Gold.com is a relatively small listed company by market value, and its share-price history has been volatile even though its beta is below the broader market average. That lower beta likely reflects business-specific trading patterns rather than a truly defensive profile. The company ranks in the top half of its sector on growth measures, but only in the bottom half on quality and momentum, while valuation metrics are mixed.
The most striking features are the near-100% year-over-year revenue increase, strong five-year growth in revenue per share, and a very large recent free-cash-flow figure. At the same time, profitability ratios remain modest: operating margin is below 1% and profit margin is only around 0.3%, far below the sector median. Balance-sheet risk looks limited right now, with very low debt-to-equity and net cash rather than net debt, which is an important stabilizer for a business exposed to commodity-price swings and changing retail demand.
The stock’s path over the last several years also helps frame expectations. It has moved through sharp rallies and pullbacks rather than a smooth long-term climb, which is typical for businesses tied to precious-metals sentiment. More recently, the share price has been much stronger on a 12-month basis, but the short-term trend has cooled compared with the sector.
Growth
Gold.com operates in a sector that can benefit from several durable long-term themes: continued interest in gold as a store of value, rising comfort with digital financial platforms, and demand for alternatives to traditional savings instruments during periods of inflation, geopolitical tension, or concerns about the banking system. These are favorable structural conditions for a company that makes bullion ownership simpler and more accessible online.
The company’s strategy appears sensible if management can keep scaling transaction volume while building more recurring service revenue around storage, custody, and account relationships. A platform model can become stronger over time if more users lead to better liquidity, broader product selection, and lower customer-acquisition cost as the brand becomes better known. That said, the central growth question is not whether activity can rise, but whether economics per customer can improve enough to lift margins.
Earnings per share show that growth has not been linear. Results were stronger in 2022 and 2023, weakened materially through 2024 and especially 2025, then rebounded in 2026. That pattern suggests the company is still sensitive to shifts in market conditions, trading activity, and its cost structure. For a long-term view, the rebound matters, but the earlier drop also shows that this is not yet a consistently compounding earnings profile.
Book value per share has trended upward over the longer term despite some fluctuation, and the latest level is well above where it stood several years ago. That points to underlying balance-sheet accumulation and gives some support to the business’s expanding scale. It is also notable that five-year book value growth is stronger than the sector median, which suggests that even with uneven earnings, the company has still been building shareholder equity at a respectable pace.
A major current catalyst is the sharp expansion in revenue in the most recent period, with total sales jumping into a much higher range than previous years. If that increase reflects sustained customer demand rather than a short-lived spike, it could create room for stronger fixed-cost absorption and better profitability. Another helpful sign is the company’s strong free cash flow and net cash position, which give it flexibility to invest in growth, absorb volatility, or strengthen services without relying heavily on external financing.
Recent public company updates also matter in this case less for headline drama and more for business execution: results indicate that activity levels have recovered meaningfully after the 2025 slowdown. For a platform tied to precious-metals demand, that recovery is the clearest sign of opportunity at the moment.
Risks
This article is for informational purposes only and does not constitute financial advice. Some content is AI-generated. See Disclaimer


