Stock Analysis · Grocery Outlet Holding Corp (GO)
Overview
Grocery Outlet Holding Corp operates a chain of discount grocery stores in the United States. Its concept is different from a traditional supermarket: instead of relying mainly on standard everyday shelf inventory, it specializes in buying branded and private-label products at opportunistic prices and passing part of that discount on to shoppers. This model is often described as “extreme value” retailing. Most stores are run by independent operators, while the company supports sourcing, distribution, marketing, and store development.
The business makes money primarily from product sales through its retail store network. Based on company filings, revenue is overwhelmingly generated from grocery and other consumable merchandise sold in stores, with operations concentrated in the U.S. The company does not report major separate operating segments with meaningful external revenue splits, so the clearest practical breakdown is by merchandise mix rather than by reported segment revenue.
- Consumables and fresh grocery items: the largest revenue source, likely well above 70% of sales. This includes pantry staples, refrigerated and frozen foods, dairy, produce, meat, and beverages.
- Non-consumable grocery and general merchandise: a smaller but still important share, likely in the low double digits. This includes health and beauty, household products, seasonal goods, and assorted opportunistic closeout items.
- Other revenue: a small contribution from items such as fees and ancillary store-related income, not disclosed as a major standalone driver.
What makes Grocery Outlet notable is that its assortment can change frequently depending on available deals from suppliers. That creates a “treasure hunt” experience for customers and can help the chain stand out in a crowded grocery market. The tradeoff is that inventory availability is less predictable than in a conventional supermarket.
Over the last several years, sales have expanded steadily, moving from roughly $3.1 billion in 2021 to about $4.7 billion in 2025. At the same time, profitability weakened sharply in 2025 as operating costs rose much faster than revenue, pushing operating income and net income into negative territory.
The long-term pattern is easy to see: revenue and gross profit kept climbing, but selling, general, and administrative costs also rose heavily. That means the business has recently had a cost-control problem rather than a demand problem alone.
Key Figures
| Metric | Value | Sector ⓘ |
|---|---|---|
| Date | Oct 17, 2026 | |
| Context | ||
| Sector | Consumer Defensive | |
| Industry | Grocery Stores | |
| Market Cap ⓘ | $1.18B | |
| Beta ⓘ | 0.67 | |
Value (Cheapness) | ||
| P/E Ratio ⓘ | N/A | 17.88 |
| P/B Ratio ⓘ | 1.51 | 1.29 |
| FCF Yield ⓘ | -1.37% | 12.39% |
| Dividend Yield ⓘ | N/A | 2.85% |
| EBIT / EV ⓘ | -12.86% | 6.43% |
| PEG ⓘ | N/A | |
Growth (Business expansion) | ||
| Revenue Growth ⓘ | 1.10% | 4.10% |
| RPS Growth (5Y CAGR) ⓘ | 11.49% | 6.18% |
| EPS Growth (5Y CAGR) ⓘ | -33.76% | -13.59% |
| BVPS Growth (5Y CAGR) ⓘ | -0.28% | 3.20% |
| Margin Growth (5Y Trend) ⓘ | -7.66% | -0.15% |
| FCF Growth (5Y CAGR) ⓘ | -7.44% | 4.10% |
| DPS Growth (5Y CAGR) ⓘ | N/A | 6.79% |
Quality (Business durability) | ||
| ROIC (Latest) ⓘ | -20.24% | 12.34% |
| ROA (Latest) ⓘ | -11.98% | 6.30% |
| ROIC (5Y Median) ⓘ | 5.35% | 10.49% |
| ROA (5Y Median) ⓘ | 2.39% | 5.44% |
| Net Debt / EBIT (Latest) ⓘ | N/A | 1.96 |
| Net Debt / EBIT (5Y Median) ⓘ | 13.94 | 2.35 |
| Net Debt / EBITDA (Latest) ⓘ | N/A | 1.38 |
| Net Debt / Assets ⓘ | 59.33% | 21.51% |
| EBITDA / Interest ⓘ | N/A | 9.46 |
| Operating Margin (Latest) ⓘ | -7.82% | 8.87% |
| Operating Margin (5Y Median) ⓘ | 2.65% | 9.53% |
| Debt to Equity (Latest) ⓘ | 226.66% | 72.35% |
| Profit Margin (Latest) ⓘ | -8.04% | 5.40% |
| Free Cash Flow (Latest) ⓘ | -$16.21M | |
Momentum (Price trend) | ||
| 3Y Return ⓘ | -55.16% | +20.92% |
| 12M Return (excl. last month) ⓘ | -36.69% | +2.13% |
| 6M Return ⓘ | +75.28% | +1.26% |
| Price vs. 200-Day MA ⓘ | +31.98% | +1.39% |
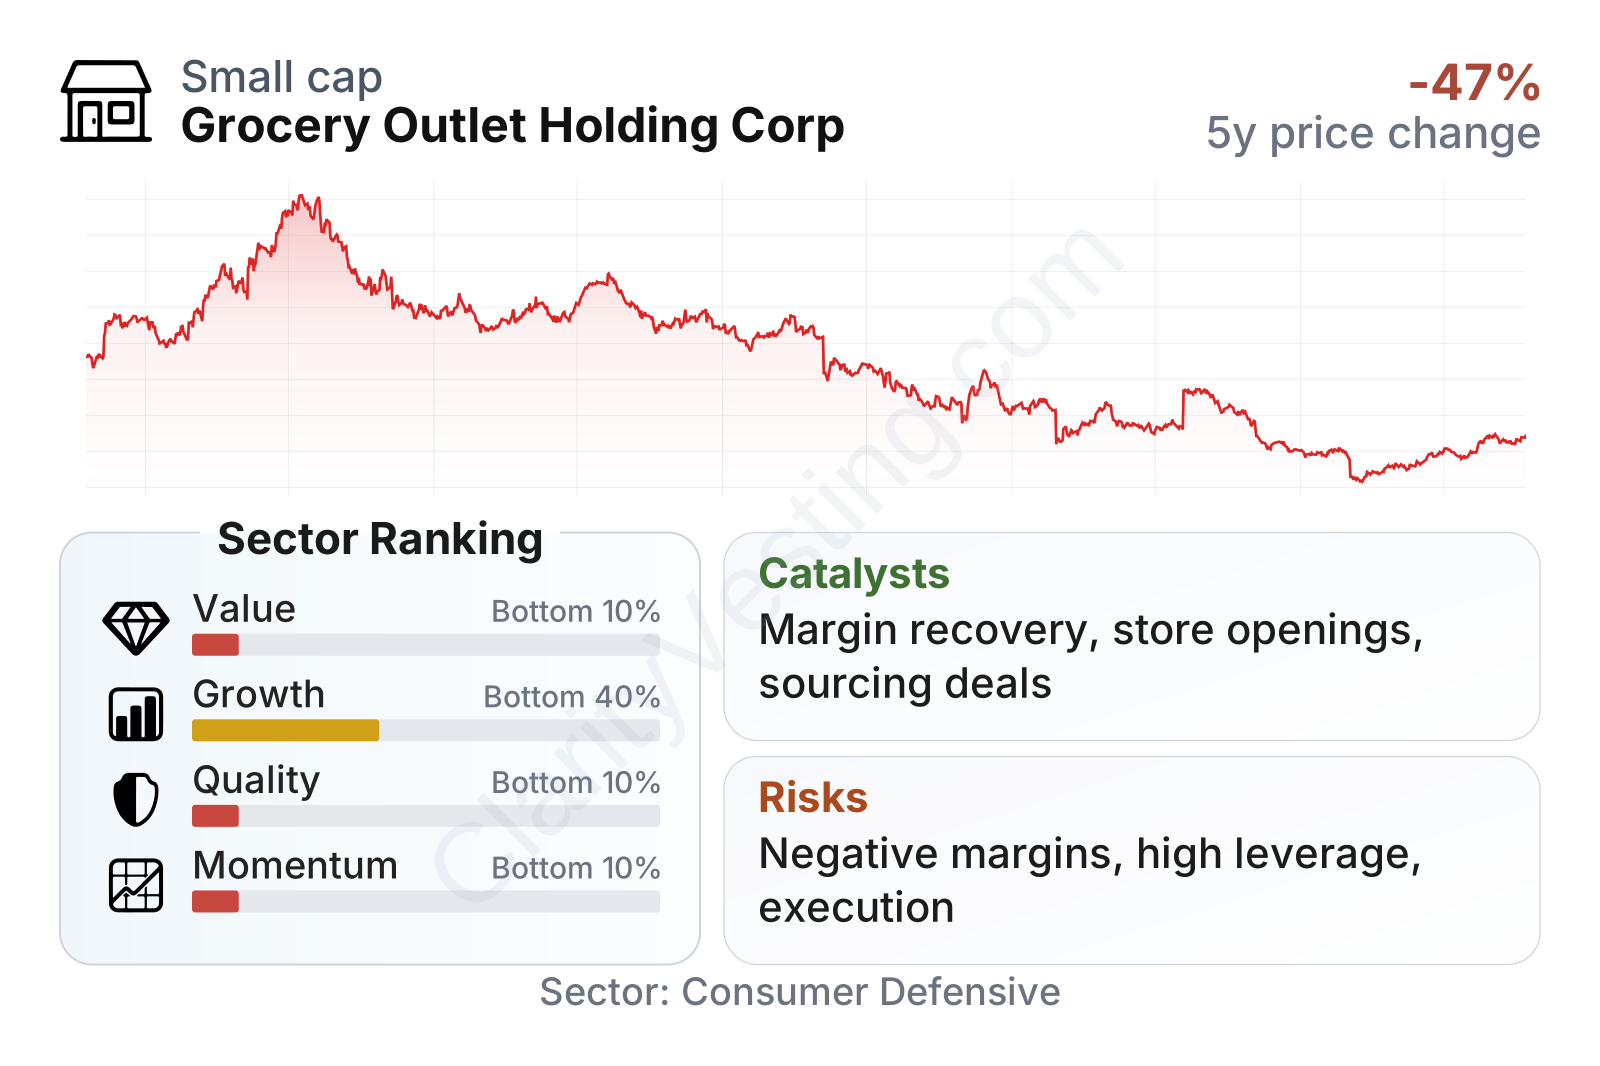
The overall profile is currently weak relative to much of the consumer defensive sector. Value, quality, and momentum rank near the bottom of the peer group, while growth is also below the sector median recently. The business is still showing strong multiyear revenue expansion, but that has been offset by weaker earnings, negative free cash flow, and a much heavier balance-sheet load than many grocery peers. The stock has also been very volatile over the last few years, with a major drawdown followed by a partial rebound in 2026.
In size terms, Grocery Outlet is a small public company by large-cap retail standards, with a relatively low beta for a stock that has nonetheless experienced a large price decline. That combination suggests the share price has been driven more by company-specific execution issues than by broad market swings.
Growth
Discount grocery is part of a durable area of retail. Consumers consistently need food, and value-focused formats often attract extra attention when budgets are tight. That gives Grocery Outlet exposure to a defensive category with structural relevance. The company’s model can also become more attractive during periods when shoppers trade down from traditional supermarkets and look harder for bargains.
The company’s strategy still makes sense on paper. It combines three elements that can support expansion over time: opportunistic sourcing, locally run stores, and unit growth in new and existing markets. Grocery Outlet has historically expanded through new store openings, and management has continued to present white-space opportunities in the U.S. grocery market. Its independent operator model can also improve local execution because store operators have direct incentives tied to performance.
Growth, however, has clearly slowed. Year-over-year revenue gains were once running in the high single digits to high teens, but more recent growth has cooled to low single digits, including roughly 1% in the latest period shown. That is a meaningful shift for a retailer that previously depended on stronger top-line momentum to absorb fixed costs.
Cash generation also weakened materially. Free cash flow moved from solidly positive territory in earlier periods to negative levels more recently, although the latest trend suggests some improvement from the worst point. For a store-based retailer, sustained recovery in cash generation matters because expansion, remodels, supply chain investments, and working capital all compete for cash.
A notable potential catalyst is the continued normalization of sourcing opportunities in a fragmented food supply chain. Grocery Outlet’s model works best when manufacturers and distributors have excess inventory, packaging changes, discontinued items, or short-dated products that still have selling value. If those supply conditions remain favorable, the chain can reinforce its pricing advantage without competing purely on permanent margin sacrifice.
Another important development is leadership and execution improvement after a difficult operating period. Recent company communications in 2026 have focused on restoring consistency in comparable sales, store productivity, and profitability. If management can stabilize margins while keeping store openings on track, the business could look stronger than recent headline earnings suggest.
Risks
This article is for informational purposes only and does not constitute financial advice. Some content is AI-generated. See Disclaimer


