Stock Analysis · Genworth Financial Inc (GNW)
Overview
Genworth Financial is a U.S. insurance company focused mainly on products that protect households and lenders against major financial risks tied to housing, aging, and long-term care. Its best-known business is mortgage insurance, where it helps lenders absorb losses if a borrower defaults on a home loan. The company also manages older long-term care insurance policies and a smaller life and annuity block that is largely in runoff, meaning it is being managed for cash generation rather than expanded aggressively.
In practice, Genworth today is less a broad growth insurer and more a collection of insurance businesses with very different roles. The mortgage insurance operation is the main earnings engine and the part most tied to the U.S. housing market. The long-term care segment is strategically important because it carries large long-duration obligations, and management has spent years working on pricing actions, claims management, and reserve discipline to improve its economics over time.
Based on recent company reporting, Genworth’s revenue mix is led by premiums and investment-related income, with the largest economic contribution coming from the U.S. mortgage insurance business. A simple way to think about the business is:
- U.S. mortgage insurance: approximately 45% to 55% of consolidated revenue in recent periods. This includes insurance premiums, policy persistency, and returns linked to the credit performance of insured loans.
- Long-term care insurance: approximately 20% to 30%. This includes premiums on in-force policies and is strongly influenced by claims trends, reserve assumptions, and approved rate increases.
- Life and annuities / closed blocks and other insurance activities: approximately 10% to 20%. These are older businesses that are generally being managed for value rather than rapid expansion.
- Net investment income and corporate/other items: approximately 10% to 20%. This reflects income generated from the investment portfolio that backs insurance liabilities.
That mix matters because Genworth is no longer a straightforward life insurer. Its value depends heavily on disciplined capital management, the durability of mortgage insurance profitability, and continued progress in containing the financial burden of long-term care obligations.
The overall revenue base has trended down over the last several years, but the business has remained cash generative, with expenses and claims driving most of the swings in profit rather than headline sales alone. That makes Genworth a company where balance sheet strength and reserve execution are often more important than top-line growth.
The business flow shows a company with a fairly stable multi-billion-dollar revenue base but uneven conversion into profit. Revenue has drifted lower since 2021, while net income has been much more volatile, reflecting the sensitivity of insurance results to claims, reserves, and investment performance.
Key Figures
| Metric | Value | Sector ⓘ |
|---|---|---|
| Date | Oct 24, 2026 | |
| Context | ||
| Sector | Financial Services | |
| Industry | Insurance - Life | |
| Market Cap ⓘ | $3.34B | |
| Beta ⓘ | 0.88 | |
Value (Cheapness) | ||
| P/E Ratio ⓘ | 17.70 | 12.46 |
| P/B Ratio ⓘ | 0.45 | 1.25 |
| FCF Yield ⓘ | 12.86% | 9.82% |
| Dividend Yield ⓘ | N/A | 2.94% |
| EBIT / EV ⓘ | 15.80% | 8.11% |
| PEG ⓘ | 0.31 | |
Growth (Business expansion) | ||
| Revenue Growth ⓘ | 5.30% | 9.10% |
| RPS Growth (5Y CAGR) ⓘ | 0.27% | 12.31% |
| EPS Growth (5Y CAGR) ⓘ | -31.99% | -6.97% |
| BVPS Growth (5Y CAGR) ⓘ | -43.82% | 5.02% |
| Margin Growth (5Y Trend) ⓘ | -6.45% | -4.00% |
| FCF Growth (5Y CAGR) ⓘ | -6.99% | 4.71% |
| DPS Growth (5Y CAGR) ⓘ | -6.24% | 8.92% |
Quality (Business durability) | ||
| ROIC (Latest) ⓘ | 4.04% | 9.18% |
| ROE (Latest) ⓘ | 2.74% | 13.93% |
| ROA (Latest) ⓘ | 0.24% | 1.57% |
| ROIC (5Y Median) ⓘ | 5.00% | 7.80% |
| ROE (5Y Median) ⓘ | 1.14% | 12.15% |
| ROA (5Y Median) ⓘ | 0.34% | 1.28% |
| Net Debt / EBIT (Latest) ⓘ | -0.96 | 1.02 |
| Net Debt / EBIT (5Y Median) ⓘ | -1.50 | 0.72 |
| Net Debt / EBITDA (Latest) ⓘ | -0.72 | 0.88 |
| Operating Margin (Latest) ⓘ | 7.24% | 22.30% |
| Operating Margin (5Y Median) ⓘ | 9.94% | 24.50% |
| Debt to Equity (Latest) ⓘ | 17.19% | 59.34% |
| Profit Margin (Latest) ⓘ | 2.87% | 26.42% |
| Free Cash Flow (Latest) ⓘ | $430.00M | |
Momentum (Price trend) | ||
| 3Y Return ⓘ | +54.67% | +95.73% |
| 12M Return (excl. last month) ⓘ | +8.08% | +17.30% |
| 6M Return ⓘ | +1.71% | +6.07% |
| Price vs. 200-Day MA ⓘ | -1.83% | +5.36% |
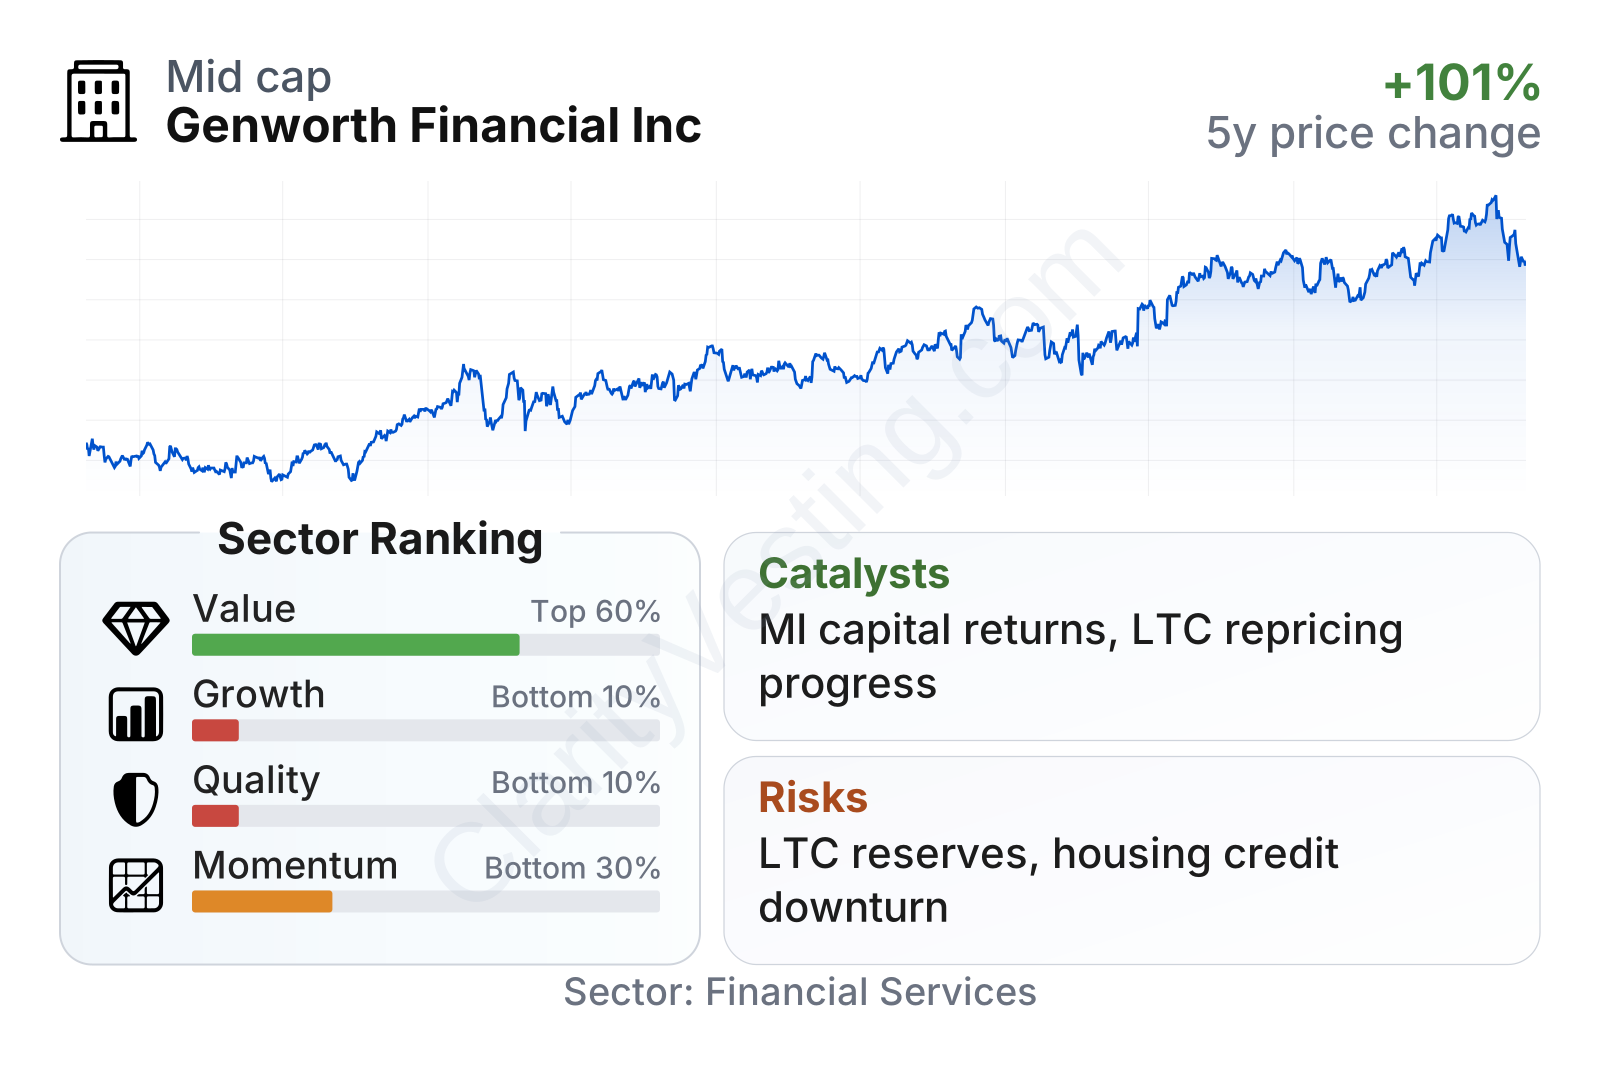
Genworth is a mid-sized insurer with a stock that has risen substantially from its 2021 levels, although its path has been uneven. The latest profile is mixed. On valuation, the shares look inexpensive on book value and cash flow measures relative to much of the sector, but earnings-based valuation is less obviously cheap because profits have been inconsistent. On growth and quality, the company ranks near the lower end of the sector, reflecting weak long-term expansion and modest profitability. One notable strength is the balance sheet: leverage appears restrained, and free cash flow remains meaningful for a company of this size.
Growth
Genworth operates in markets that are important and durable, but not all of them are naturally high-growth. Mortgage insurance benefits from long-term demand for home ownership, limited down-payment borrowers, and lender need for credit enhancement. Long-term care is tied to aging demographics, which is a real structural tailwind, but this segment is difficult because pricing and claims emerge over decades. That means the sector opportunity is real, yet the company’s growth path depends more on disciplined execution than on simple market expansion.
The strategy makes the most sense in the mortgage insurance business. This operation can produce attractive returns when underwriting stays conservative, employment remains healthy, and home prices hold up. It is also capital-light compared with carrying large new long-term care risk. For Genworth, future progress is likely to come from protecting profitability in mortgage insurance, extracting value from legacy businesses, and returning excess capital where possible rather than from rapid expansion across many product lines.
Earnings have been volatile rather than steadily compounding. After solid results earlier in the period, earnings per share turned negative in 2023 and then recovered, but recent levels remain well below the stronger years. That pattern supports the idea that Genworth’s appeal rests more on normalization potential and capital discipline than on a clean growth trajectory.
Book value per share also shows why the company is difficult to judge at a glance. After a sharp reset, book value has been rebuilding, which suggests the balance sheet has stabilized compared with the disruption seen earlier in the period. For insurers, book value is a key anchor because it represents the capital base supporting future claims and earnings capacity.
A meaningful catalyst is the continued runoff and repricing work in long-term care. If approved premium increases continue to catch up with expected claims, that business could become less of a drag on valuation. Another potential support is stronger capital flexibility from the mortgage insurance subsidiary, especially if credit performance remains favorable and regulatory capital stays comfortably above required levels.
Recent company communications have also pointed to ongoing share repurchases and capital management as an important part of the value equation. For a company trading well below book value, shrinking the share count can materially increase book value per share and improve per-share economics even without strong revenue growth.
Risks
This article is for informational purposes only and does not constitute financial advice. Some content is AI-generated. See Disclaimer


